Executive Summary
Three real environments back this build. The first is Microsoft’s own Azure Sentinel Training Lab — a PaaS-only workspace pre-loaded with synthetic incidents, used here to build a real SOAR pipeline: a password-spray-style sign-in incident automatically triggers a Logic App playbook that opens a ticket in a ServiceNow developer instance, closing the loop from detection to assignment to resolution. The second is a custom “noisy” range — a domain controller, a Windows workstation, and a Kali attack box, all feeding live Atomic Red Team telemetry into a separate Sentinel workspace — used for manual triage against realistic, varied alert volume and for triggering detections by hand rather than just reading someone else’s canned incident. The third is a genuine Microsoft 365 E5 tenant, licensed and provisioned from zero, running Defender for Endpoint and Entra ID Protection against a real onboarded VM and a real identity — used to prove what it actually takes to get a brand-new tenant into a state where any signal exists at all, and to generate detections that weren’t seeded in advance.
The interesting part of this build was never the happy path — it was what broke first, at every layer. A permissions gate Sentinel enforces separately from standard Azure RBAC. A field-mapping bug caused by the incident trigger’s actual JSON schema being three levels deeper than the designer’s dynamic-content picker assumed. A documented Microsoft command that fails when run from the wrong shell. A tenant-provisioning gate with no portal UI to fix it, only a PowerShell cmdlet. All of it is documented below as it happened, not smoothed over.
Part 1 — Two Labs, Two Jobs
Running one workspace would have been simpler. Running two was deliberate: the training lab is PaaS-only and cheap to leave running indefinitely, which makes it the right home for a permanent automation demo. The noisy range is VM-backed and more expensive to keep alive, which makes it the right home for a live-fire triage story — volume, variety, and manual attacker action — that doesn’t need to persist forever.
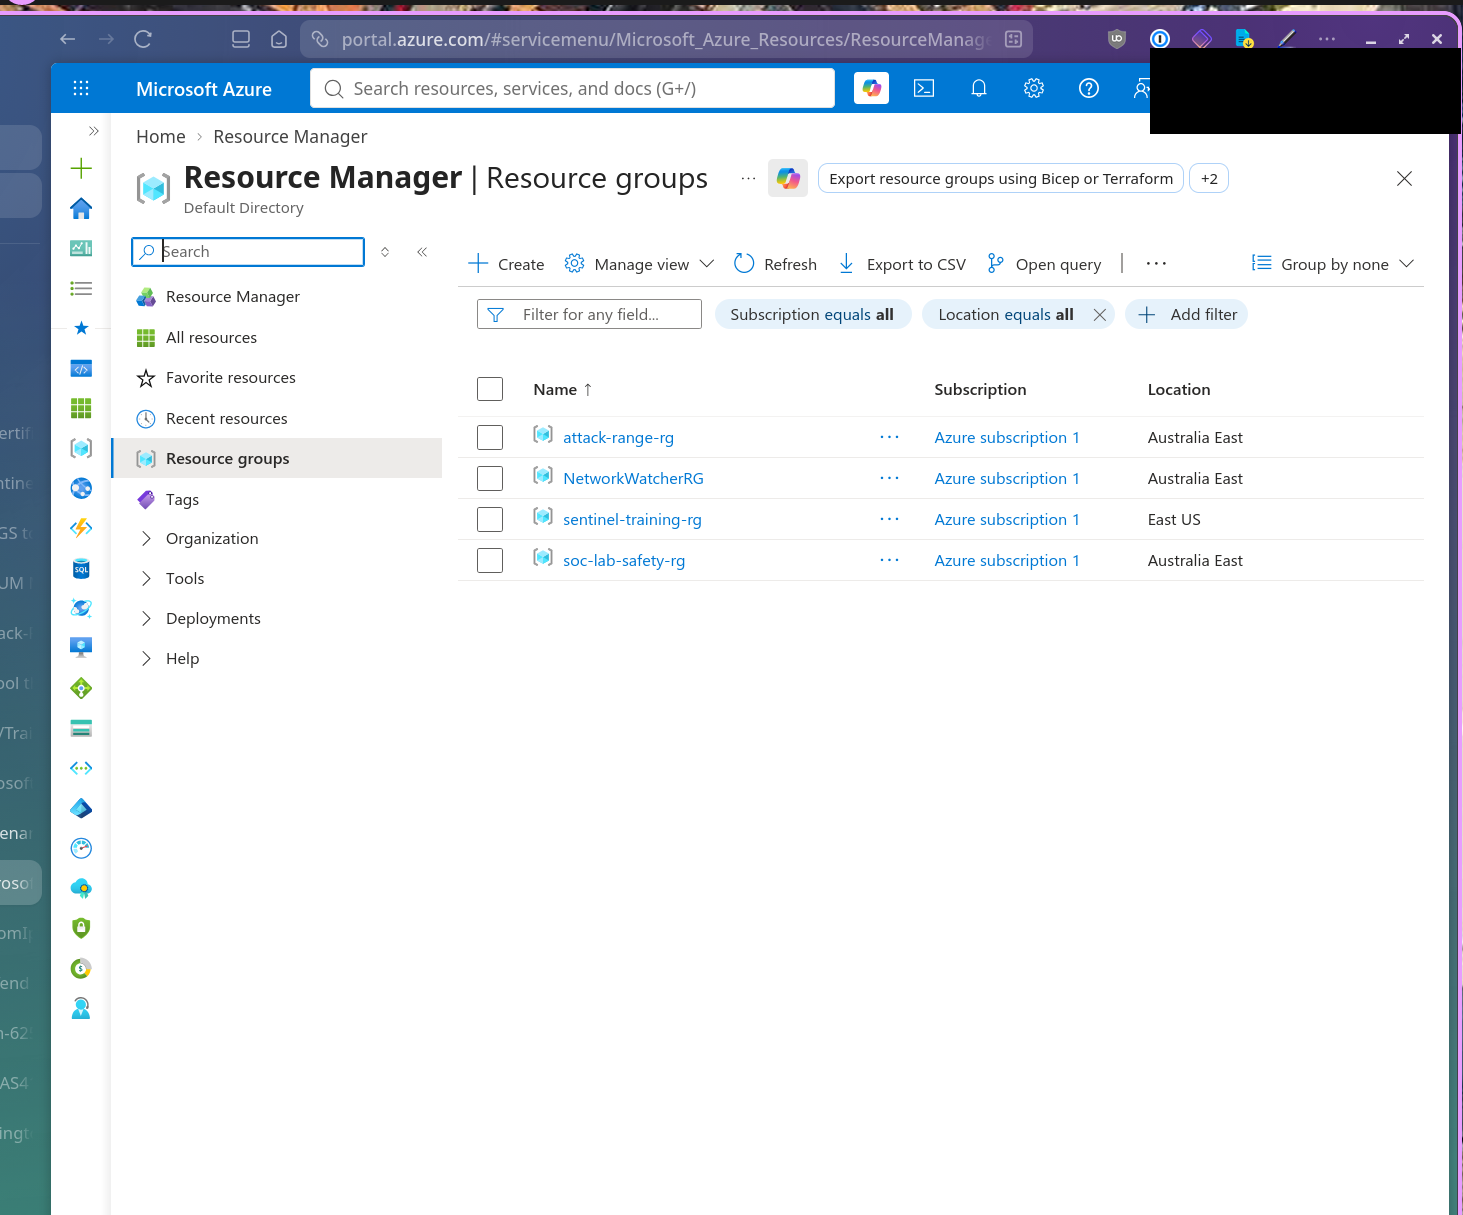
The training lab’s footprint is just the workspace itself and its API connections — nothing to patch, back up, or accidentally leave running longer than intended.
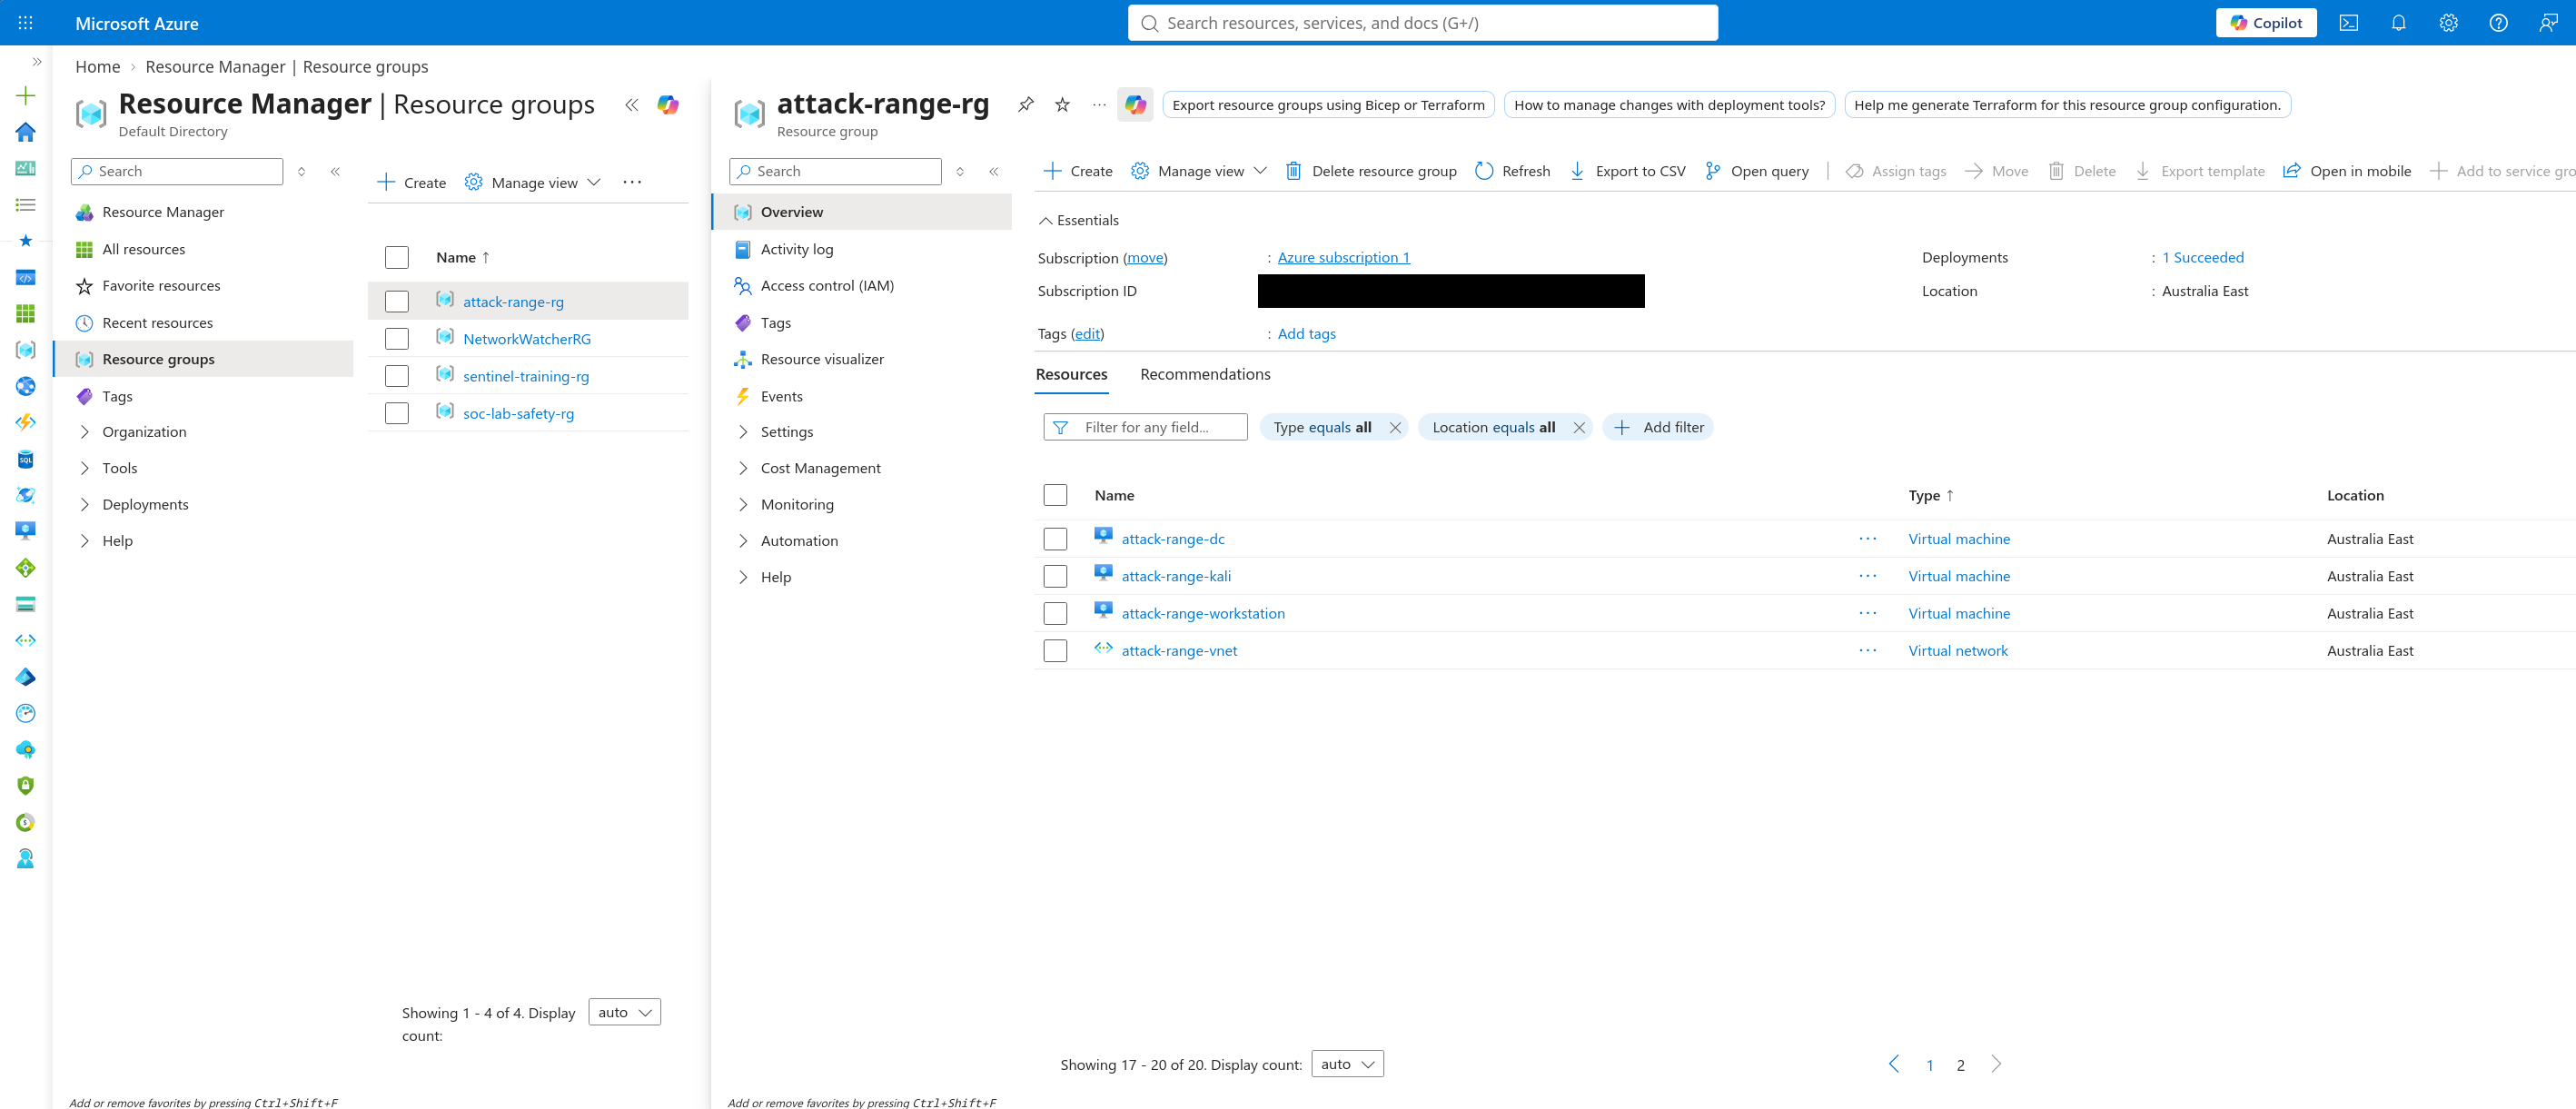
The noisy range looks different by design: a domain controller, a Windows workstation, and a Kali box, all sitting in the same resource group — the cost of realism, and exactly why this one doesn’t stay up indefinitely.
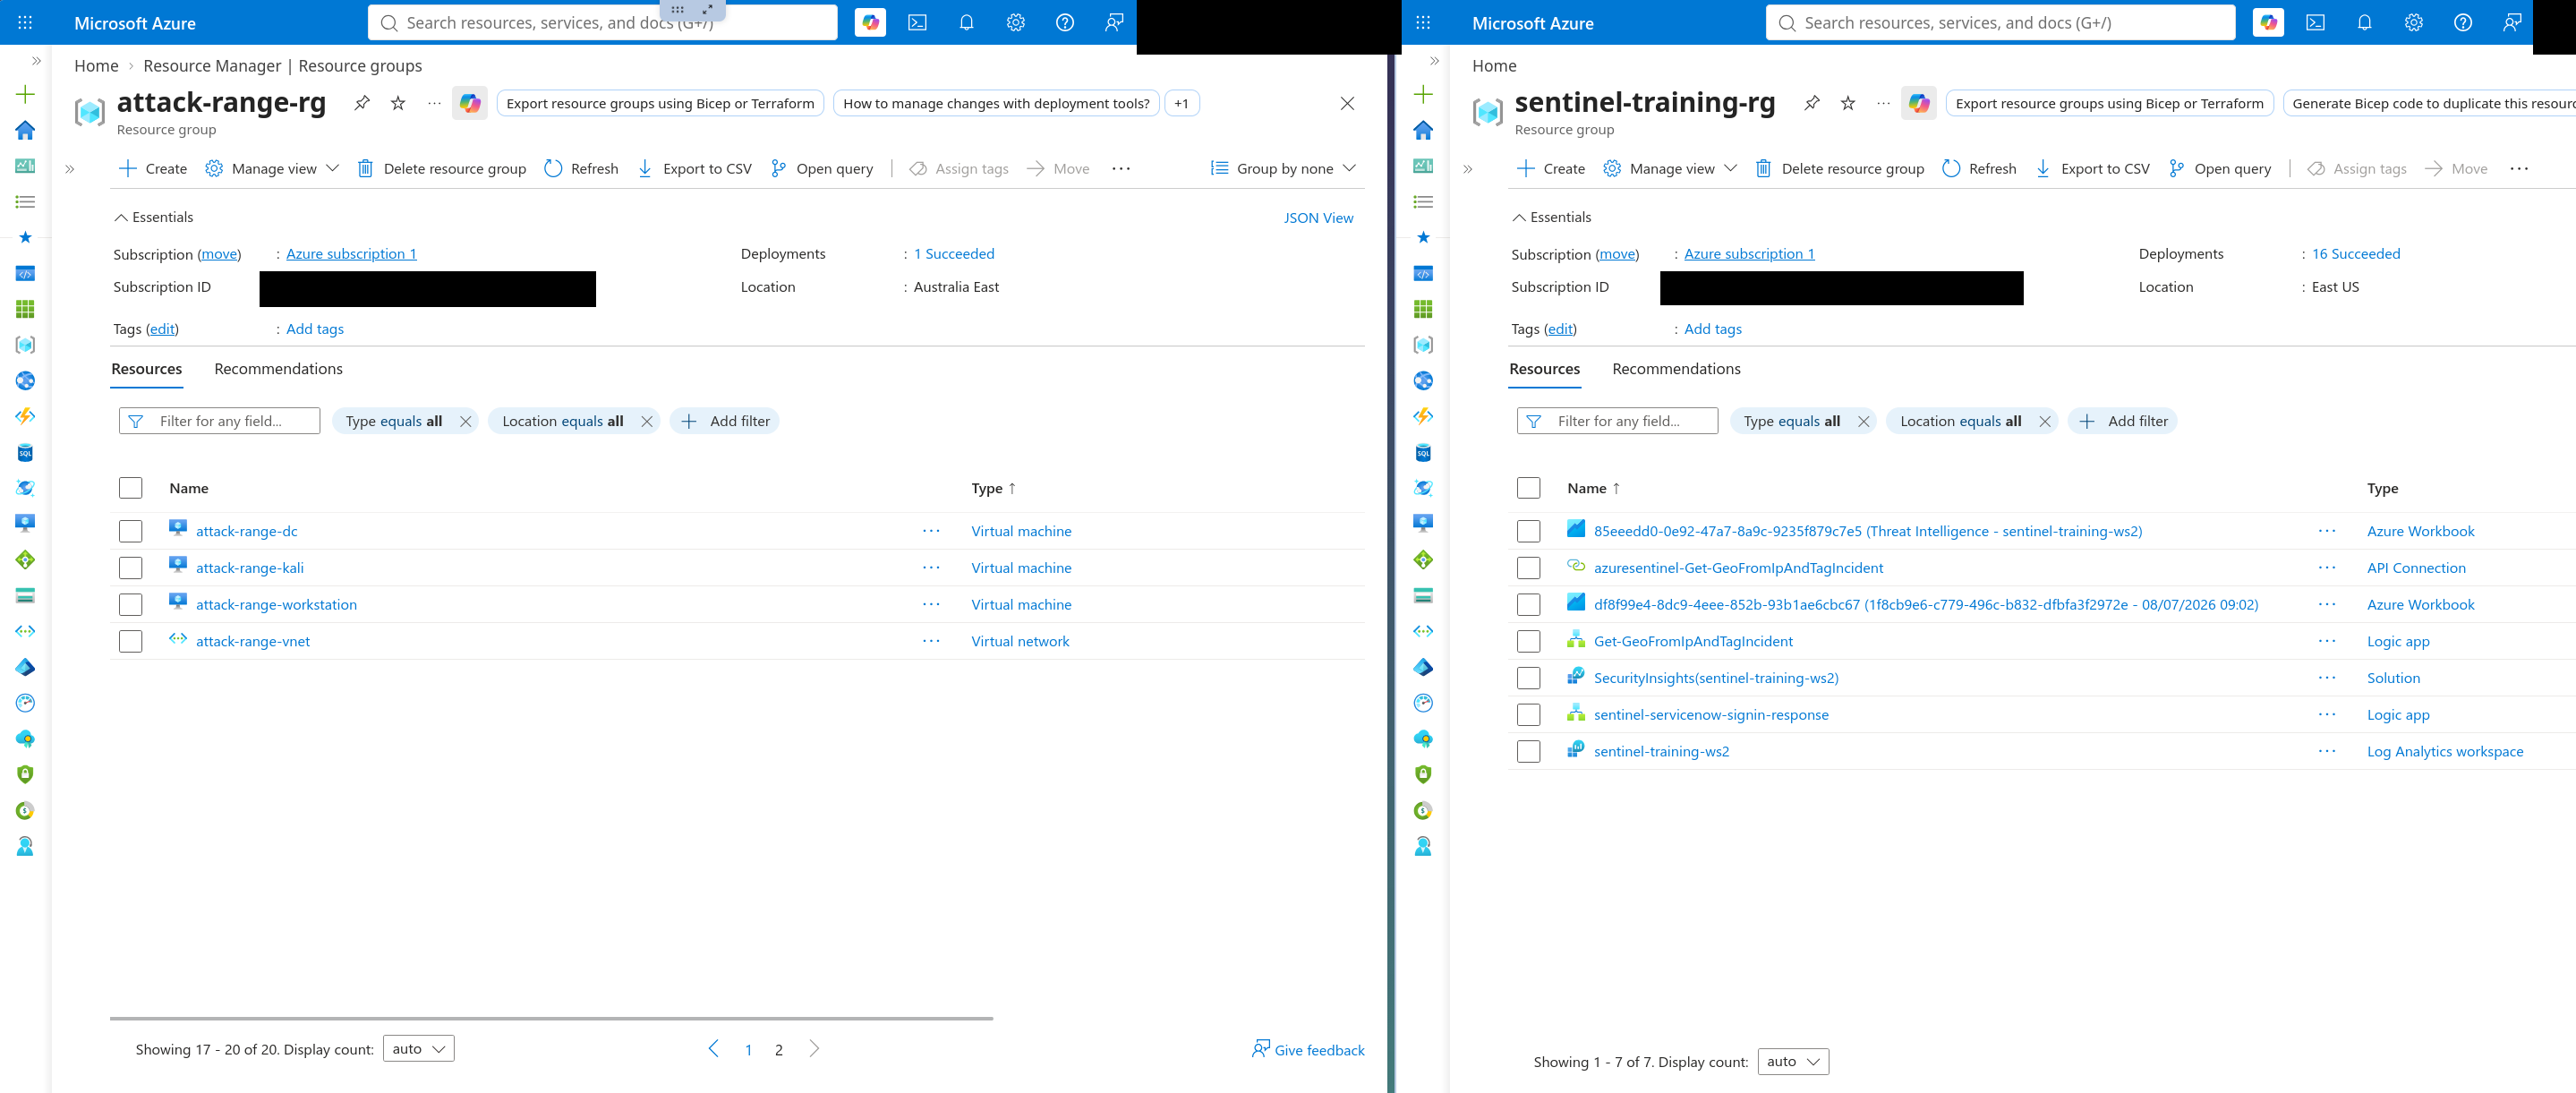
Side by side, the contrast is the whole point — one environment built to be forgotten about, one built to be torn down once it’s done its job.
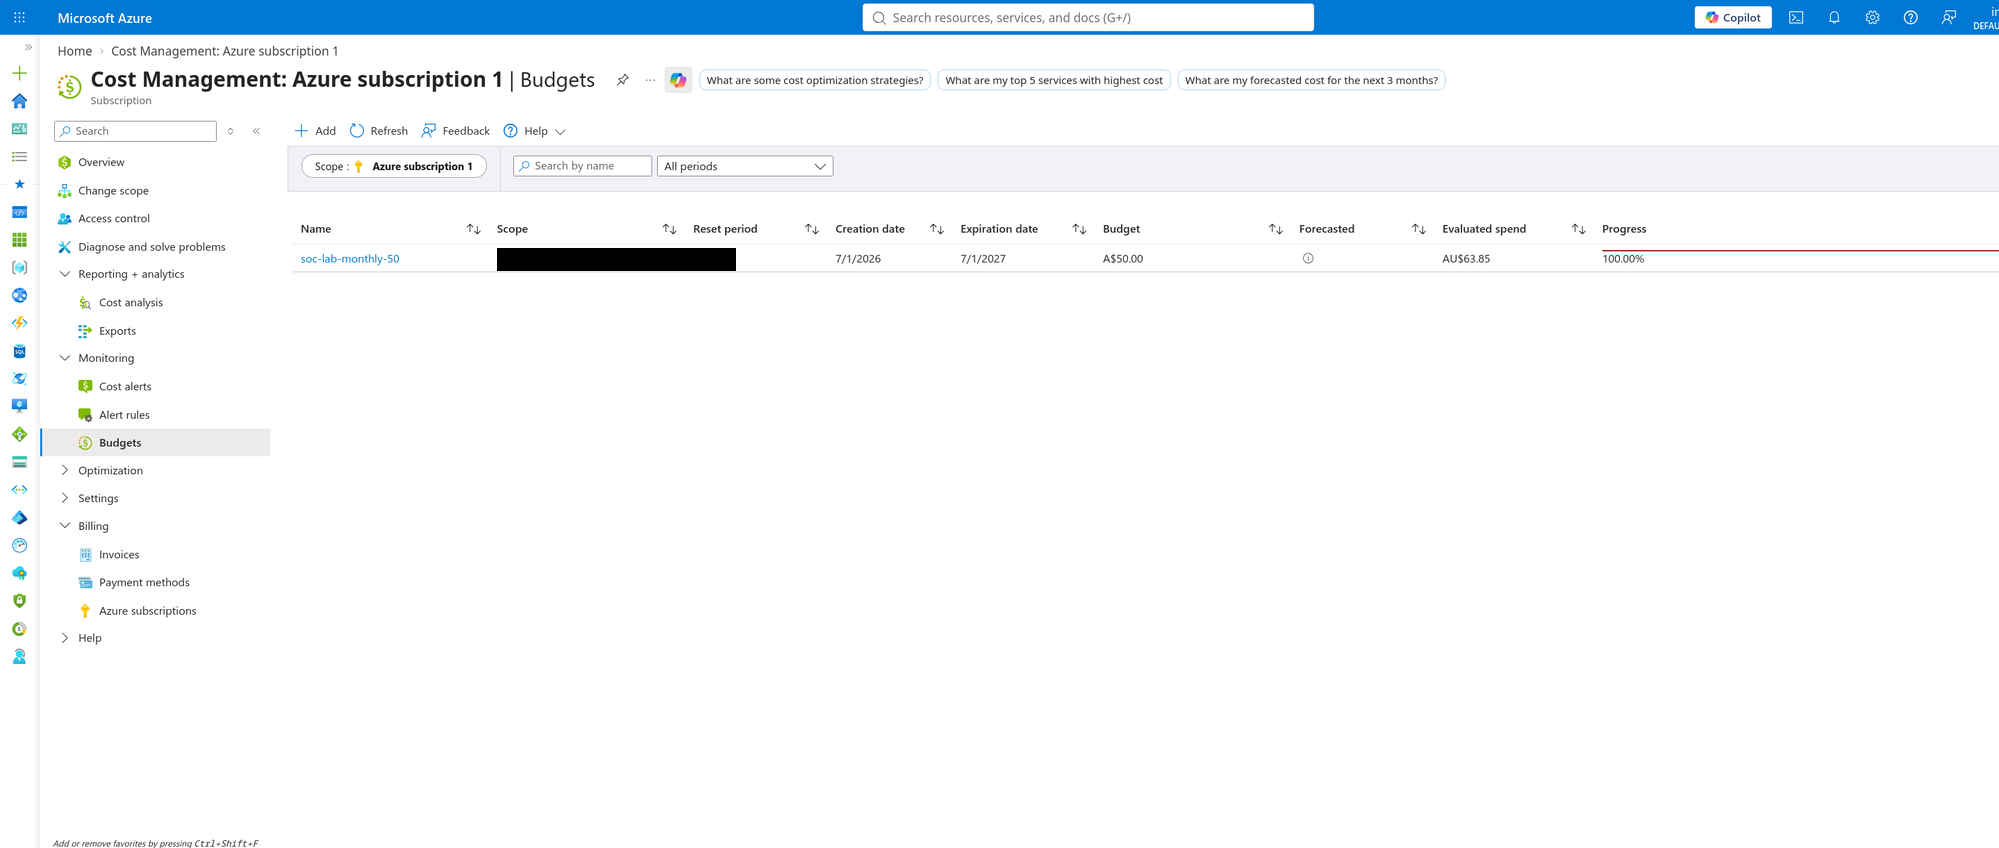 A$50 monthly budget, already tripped to AU$63.85 mid-month — proof this is running on a real, metered subscription rather than a permanently-free tier.
Part 2 — Building the Automation: Sentinel → Logic App → ServiceNow
The target was the training lab’s “Sign-ins from IPs that attempt sign-ins to disabled accounts” incident — a password-spray/account-enumeration pattern (MITRE T1110-adjacent) that flags an IP failing logins against disabled accounts before succeeding against a live one. The goal: when this incident fires, a ServiceNow ticket should appear automatically, ready to assign and work like a real analyst would.
Proving the API before automating it
Before wiring anything to Sentinel, the ServiceNow side was validated in isolation. A ServiceNow Personal Developer Instance was provisioned, and a manual POST to the Table API confirmed the exact payload shape ServiceNow expected.
POST https://dev182151.service-now.com/api/now/table/incident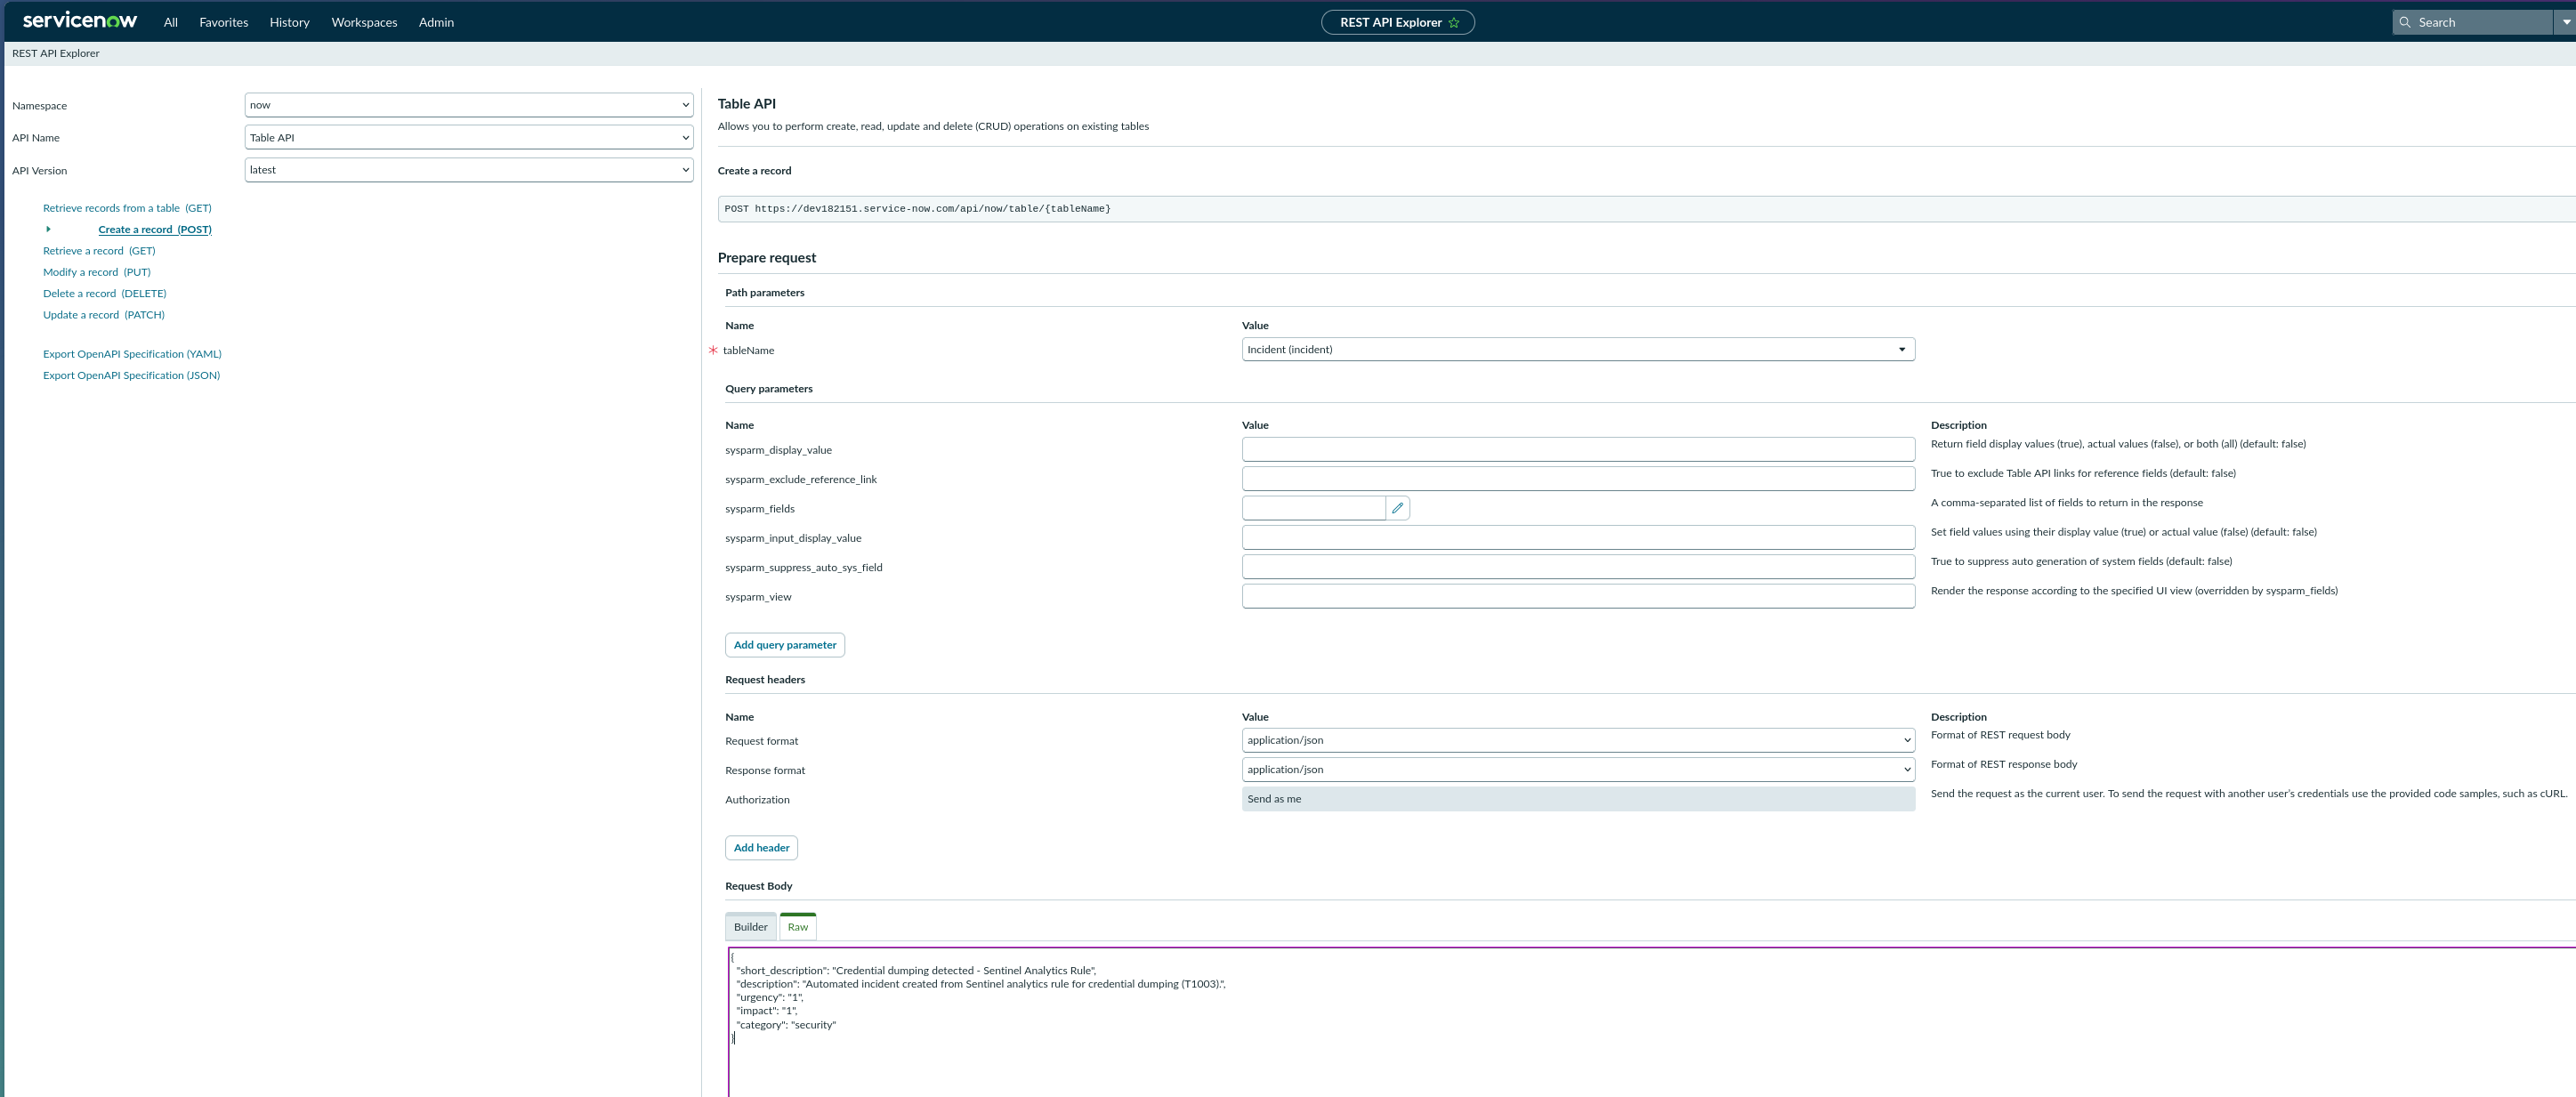 The request landed as expected —
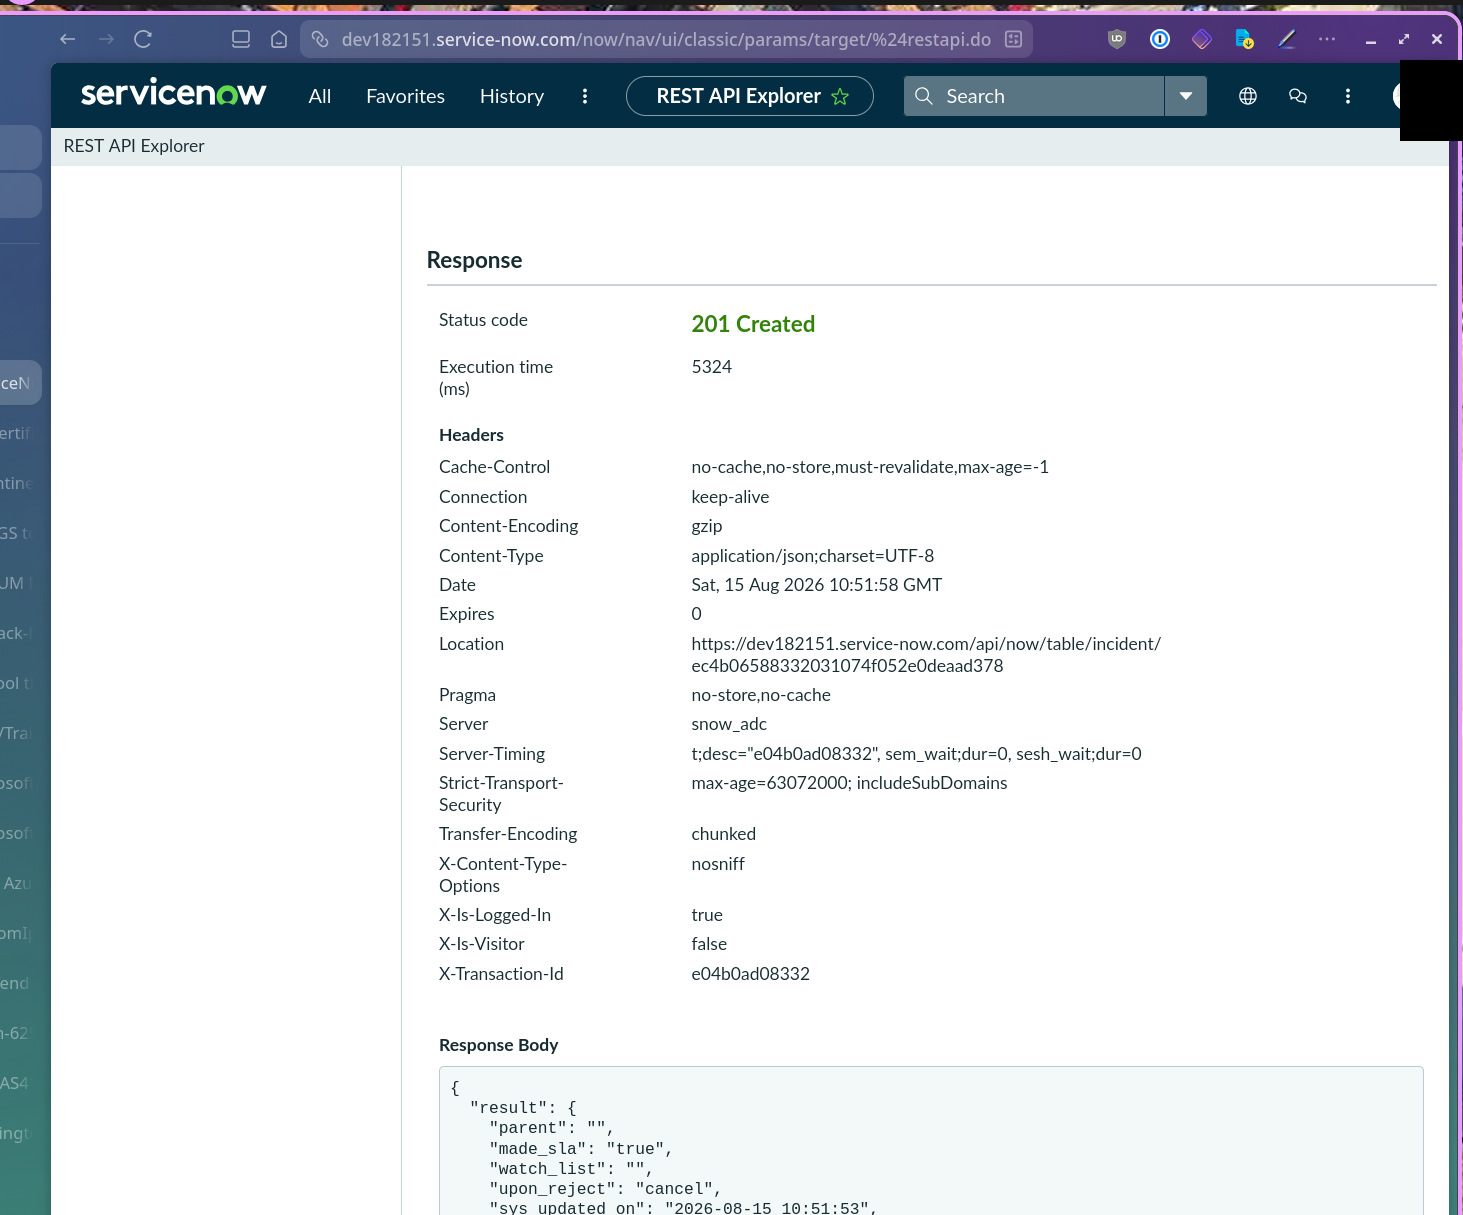
201 Created, with a returned sys_id, confirming the endpoint and payload shape both worked before any automation touched them.
Wiring the Logic App
A Consumption Logic App (sentinel-servicenow-signin-response) was built with a Microsoft Sentinel incident trigger — the trigger purpose-built to be called from a Sentinel Automation Rule, as opposed to the alert- or entity-level triggers sitting next to it in the connector picker — feeding a single HTTP action that POSTs to the same ServiceNow endpoint just validated manually.
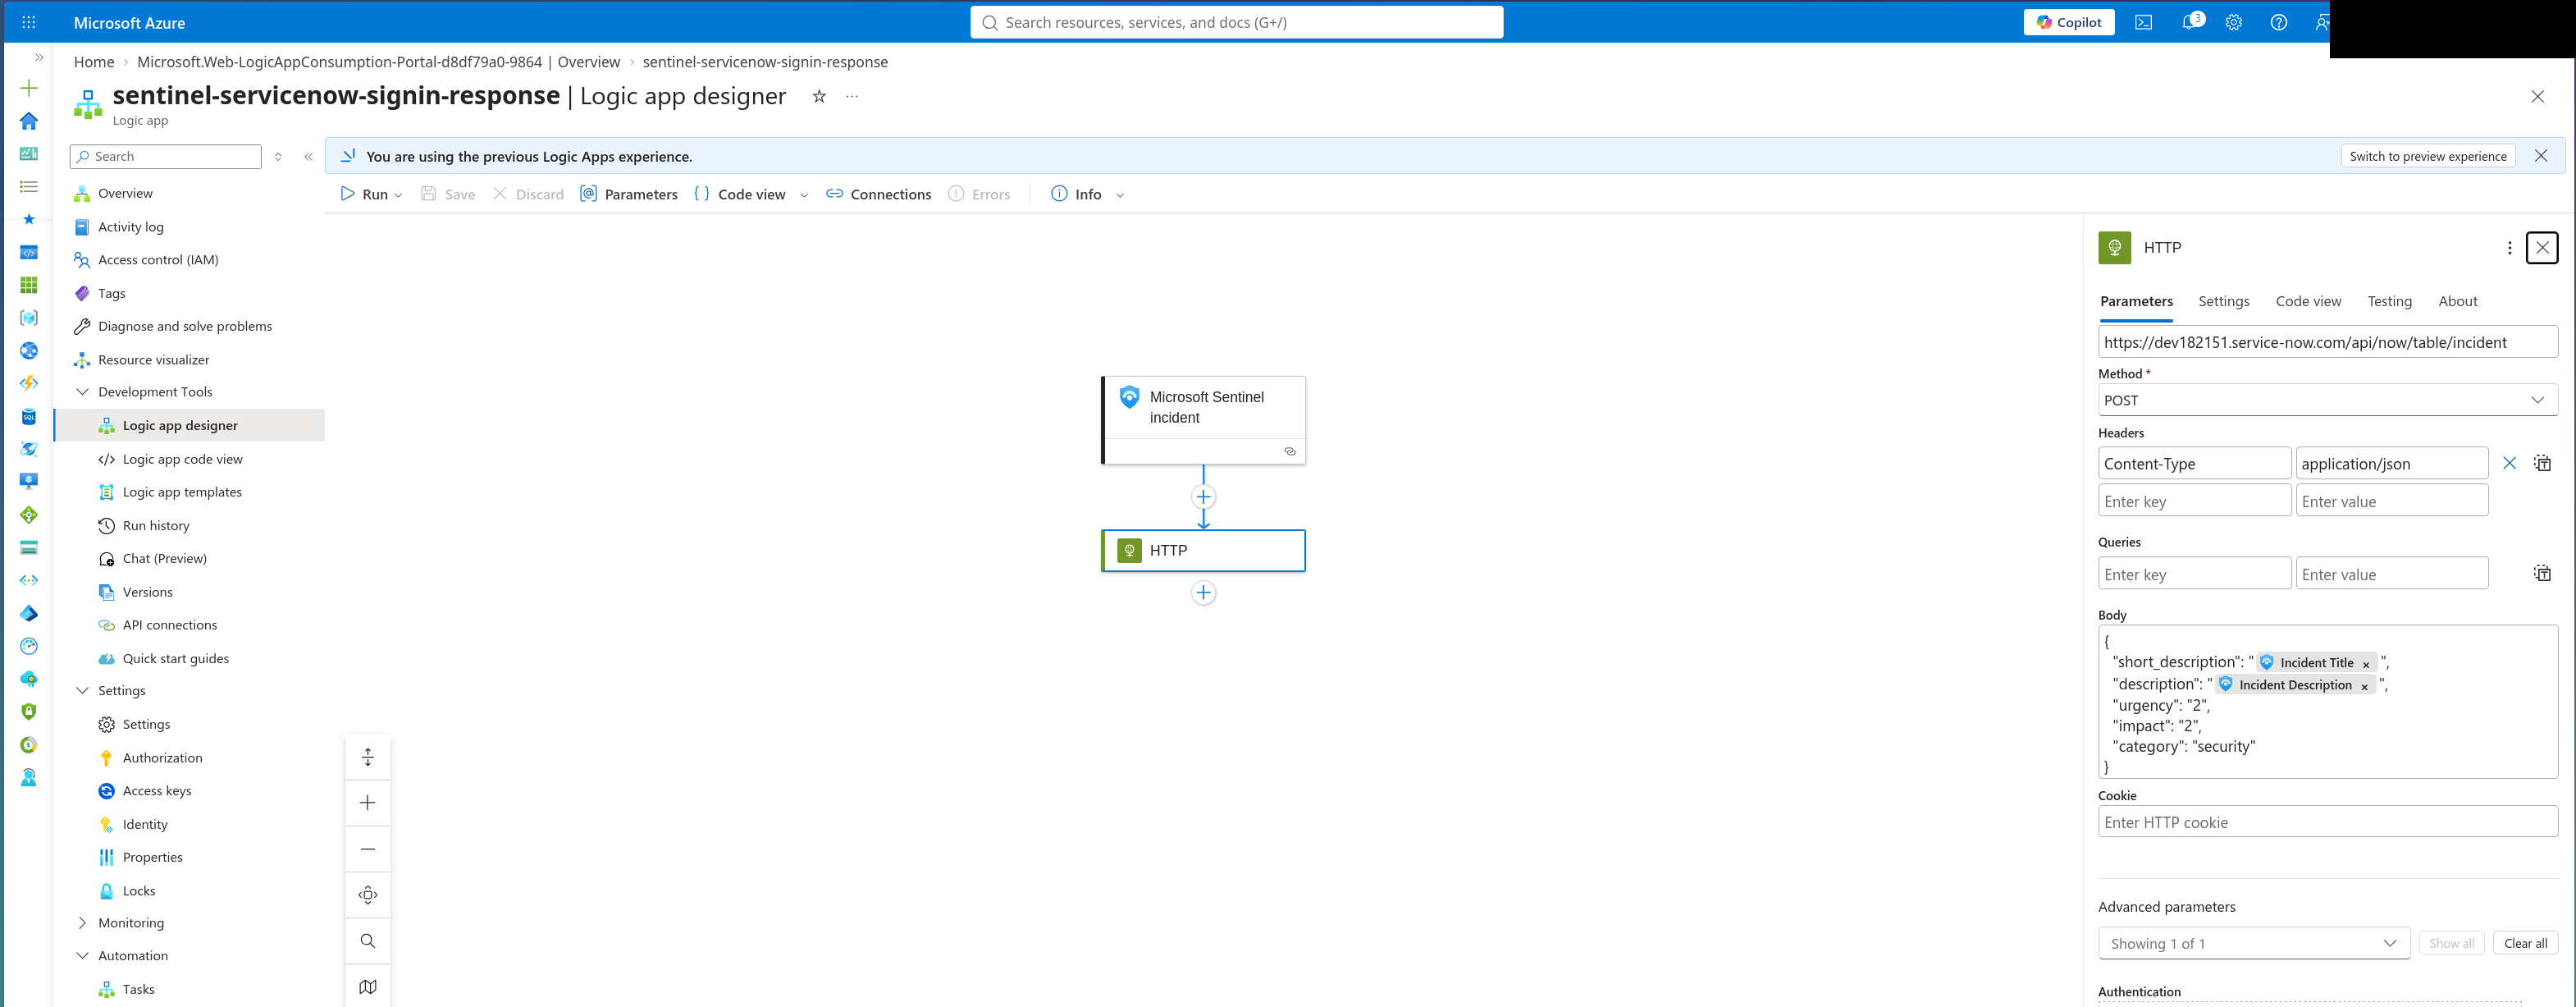
The first wall: permissions Azure RBAC doesn’t fully cover
A manual “Run playbook” against an existing incident returned:
Missing required permissions for Microsoft Sentinel on the playbook resource…
That’s the failure as it first appeared — Sentinel refusing to invoke the playbook, with no further detail on why.
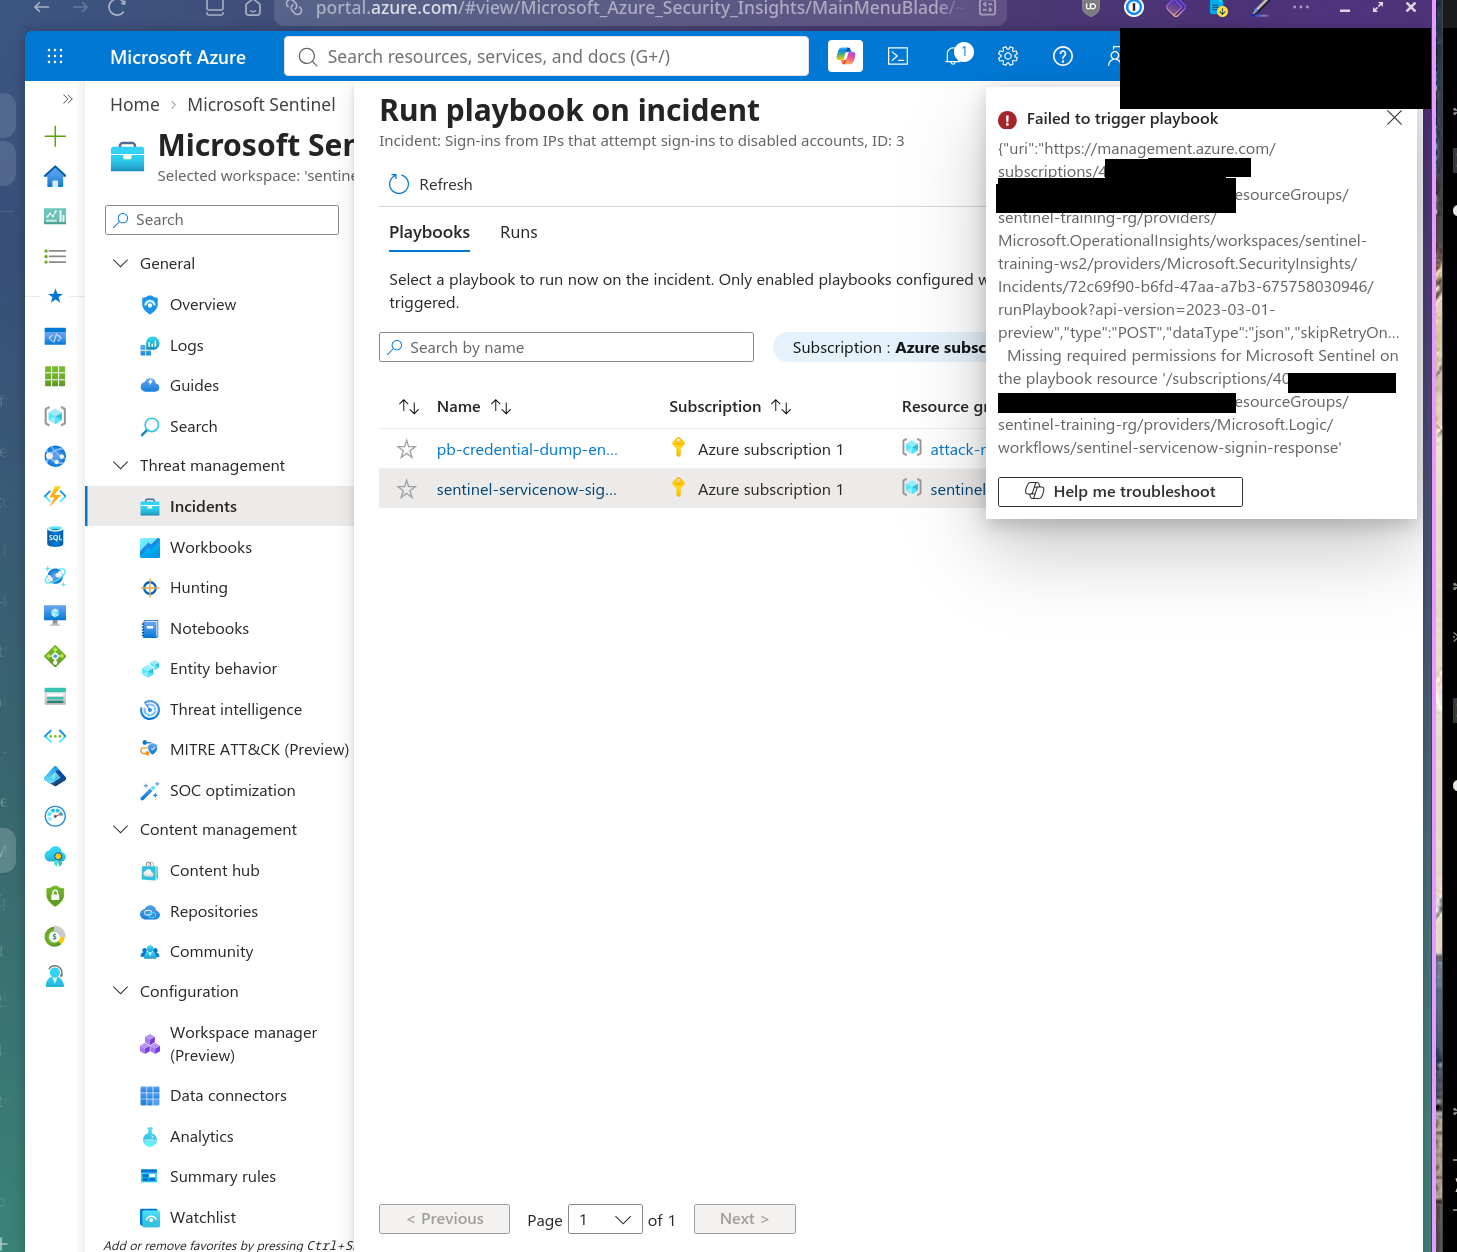
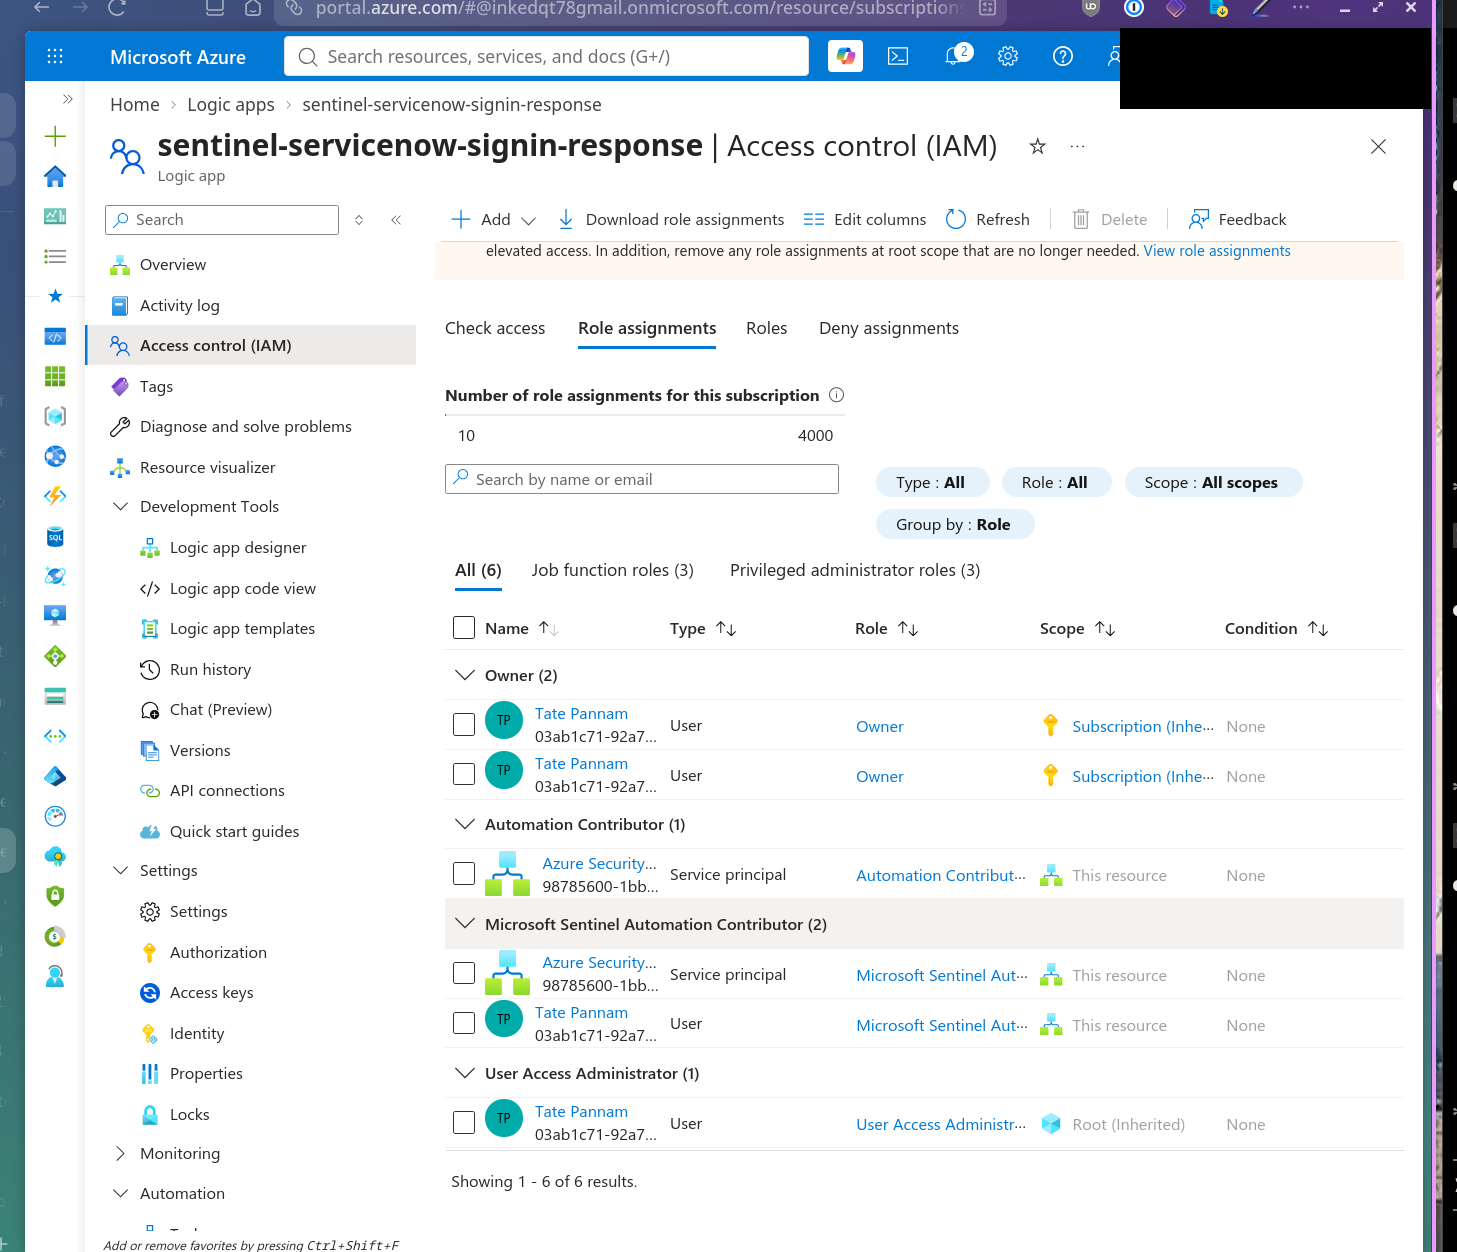
This looks like a standard RBAC gap and was treated as one first — granting the Microsoft Sentinel Automation Contributor role to the Azure Security Insights service principal, scoped to the Logic App, via Access Control (IAM). The grant landed exactly where expected, and manual runs worked immediately afterward.
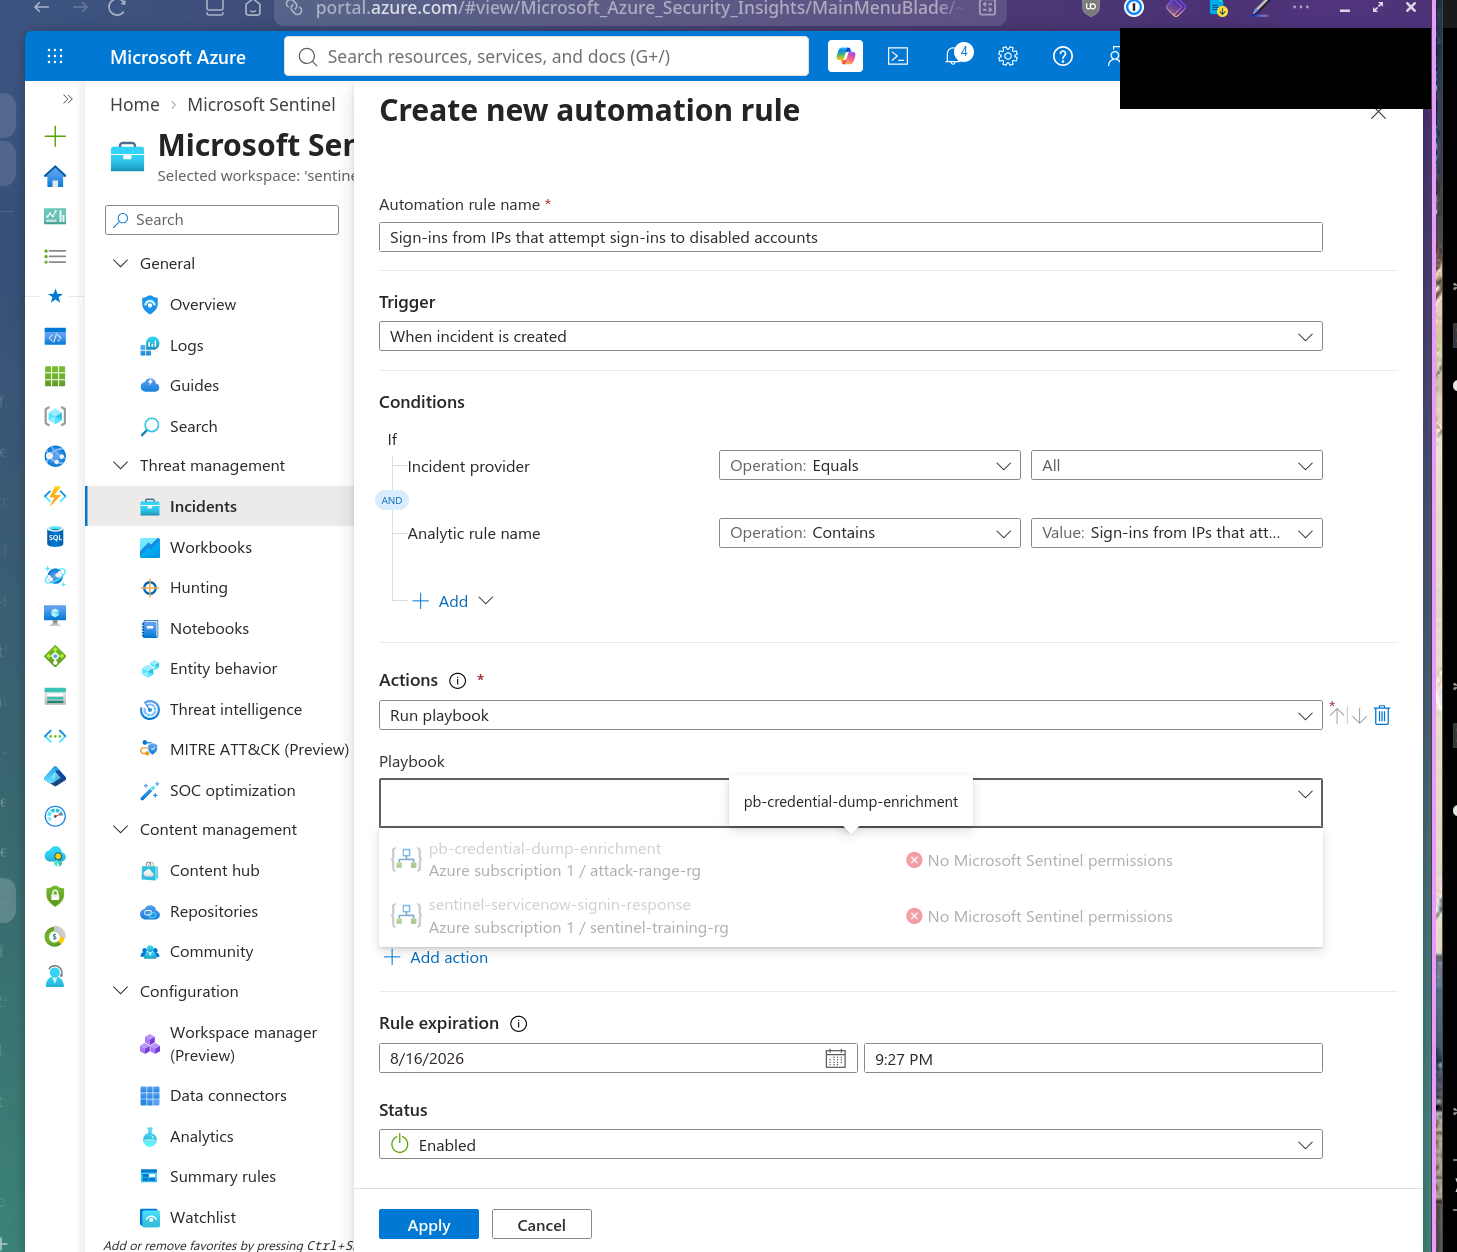
The Automation Rule disagreed anyway. Same subscription, same playbook, same account — still locked out, and every playbook in the subscription was greyed out regardless of resource group, a sign the picker was checking a different permission surface entirely.
The actual gate lives one level up, inside Sentinel itself rather than IAM: Settings → Automation → Playbook permissions, a resource-group-scoped grant purpose-built for this exact handoff.
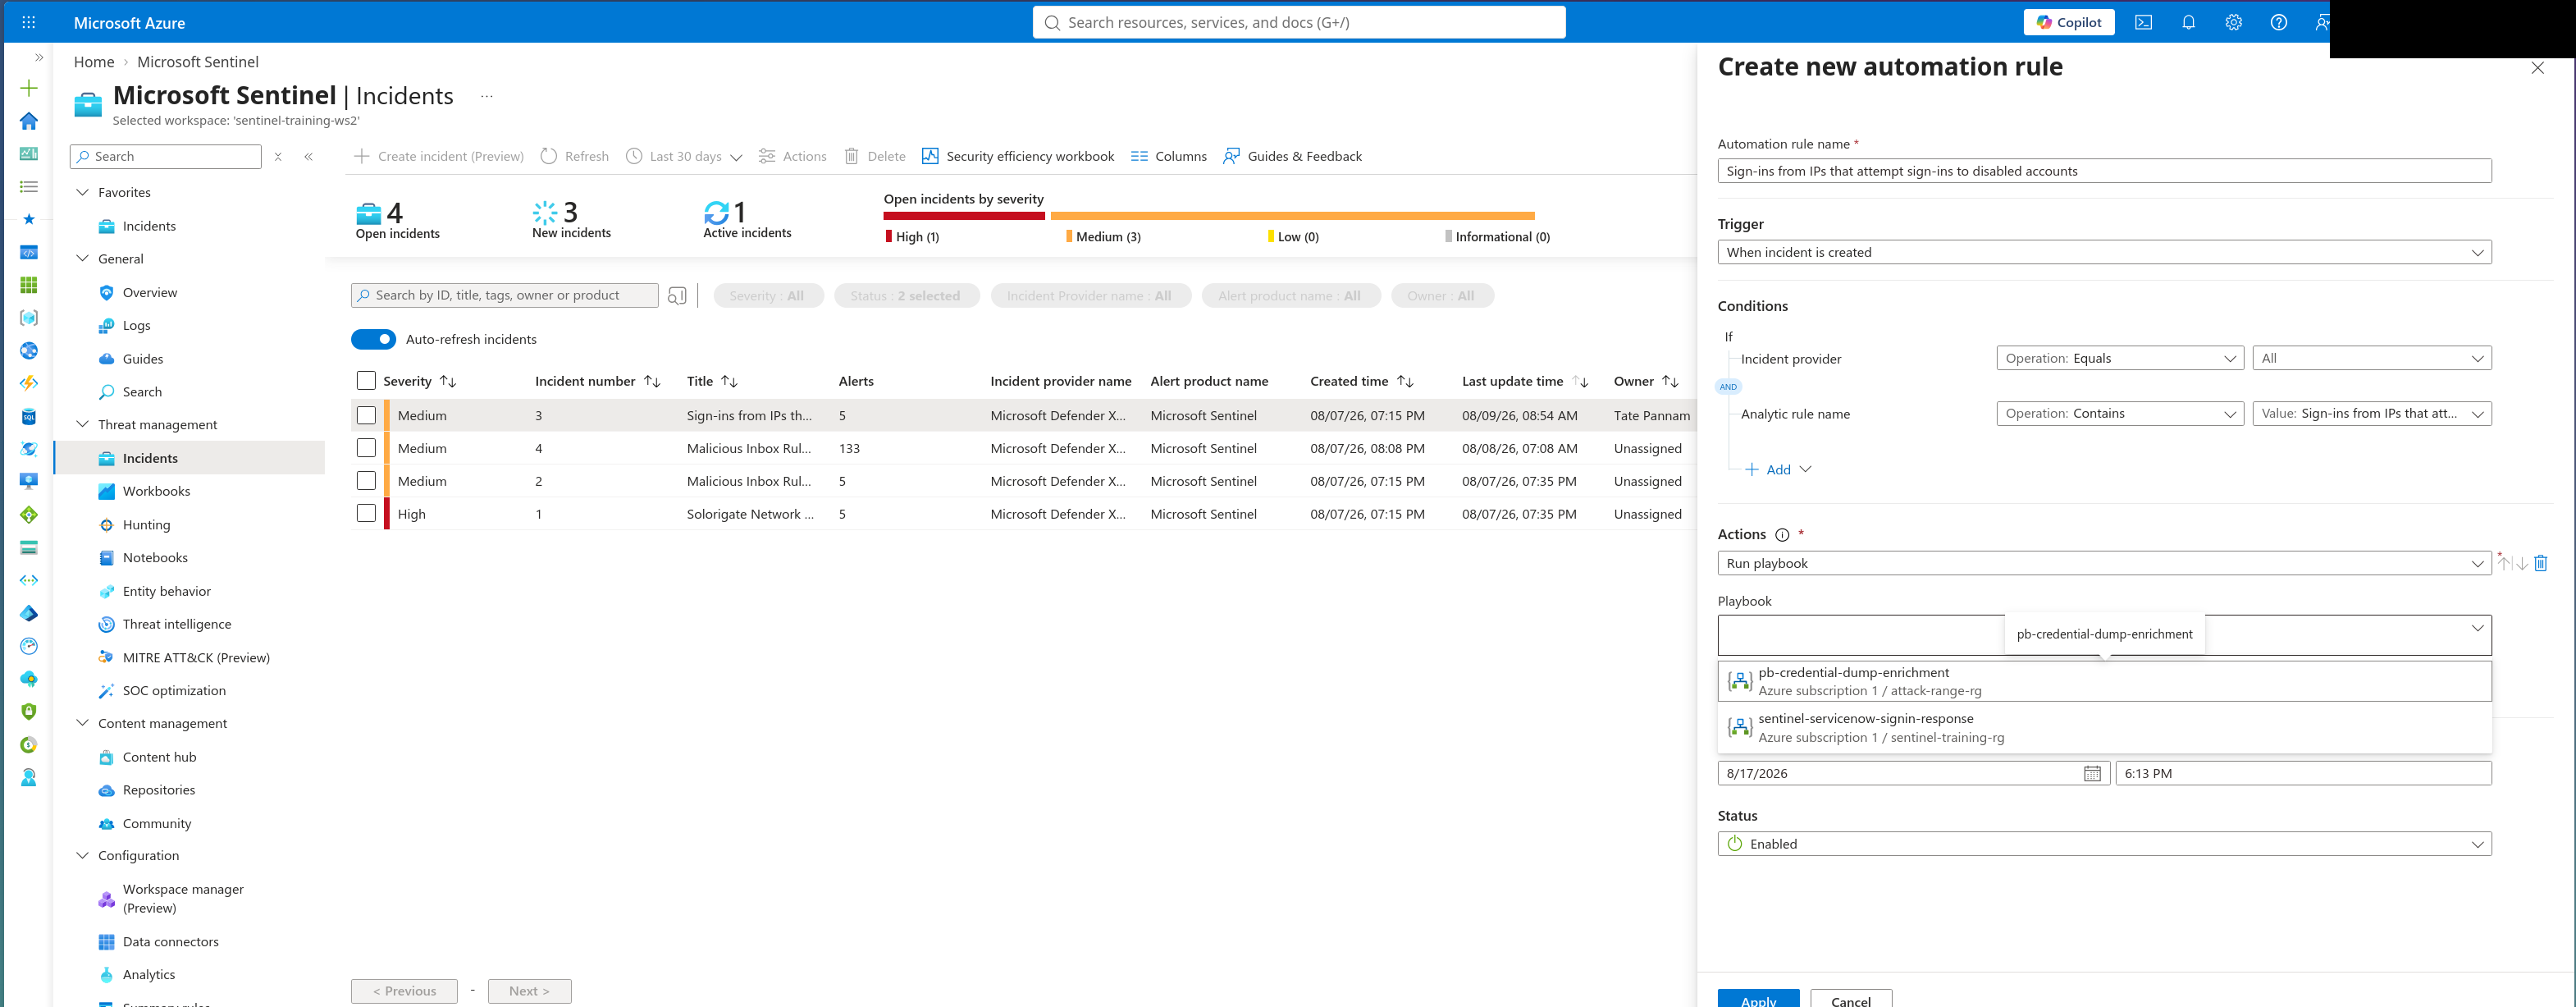
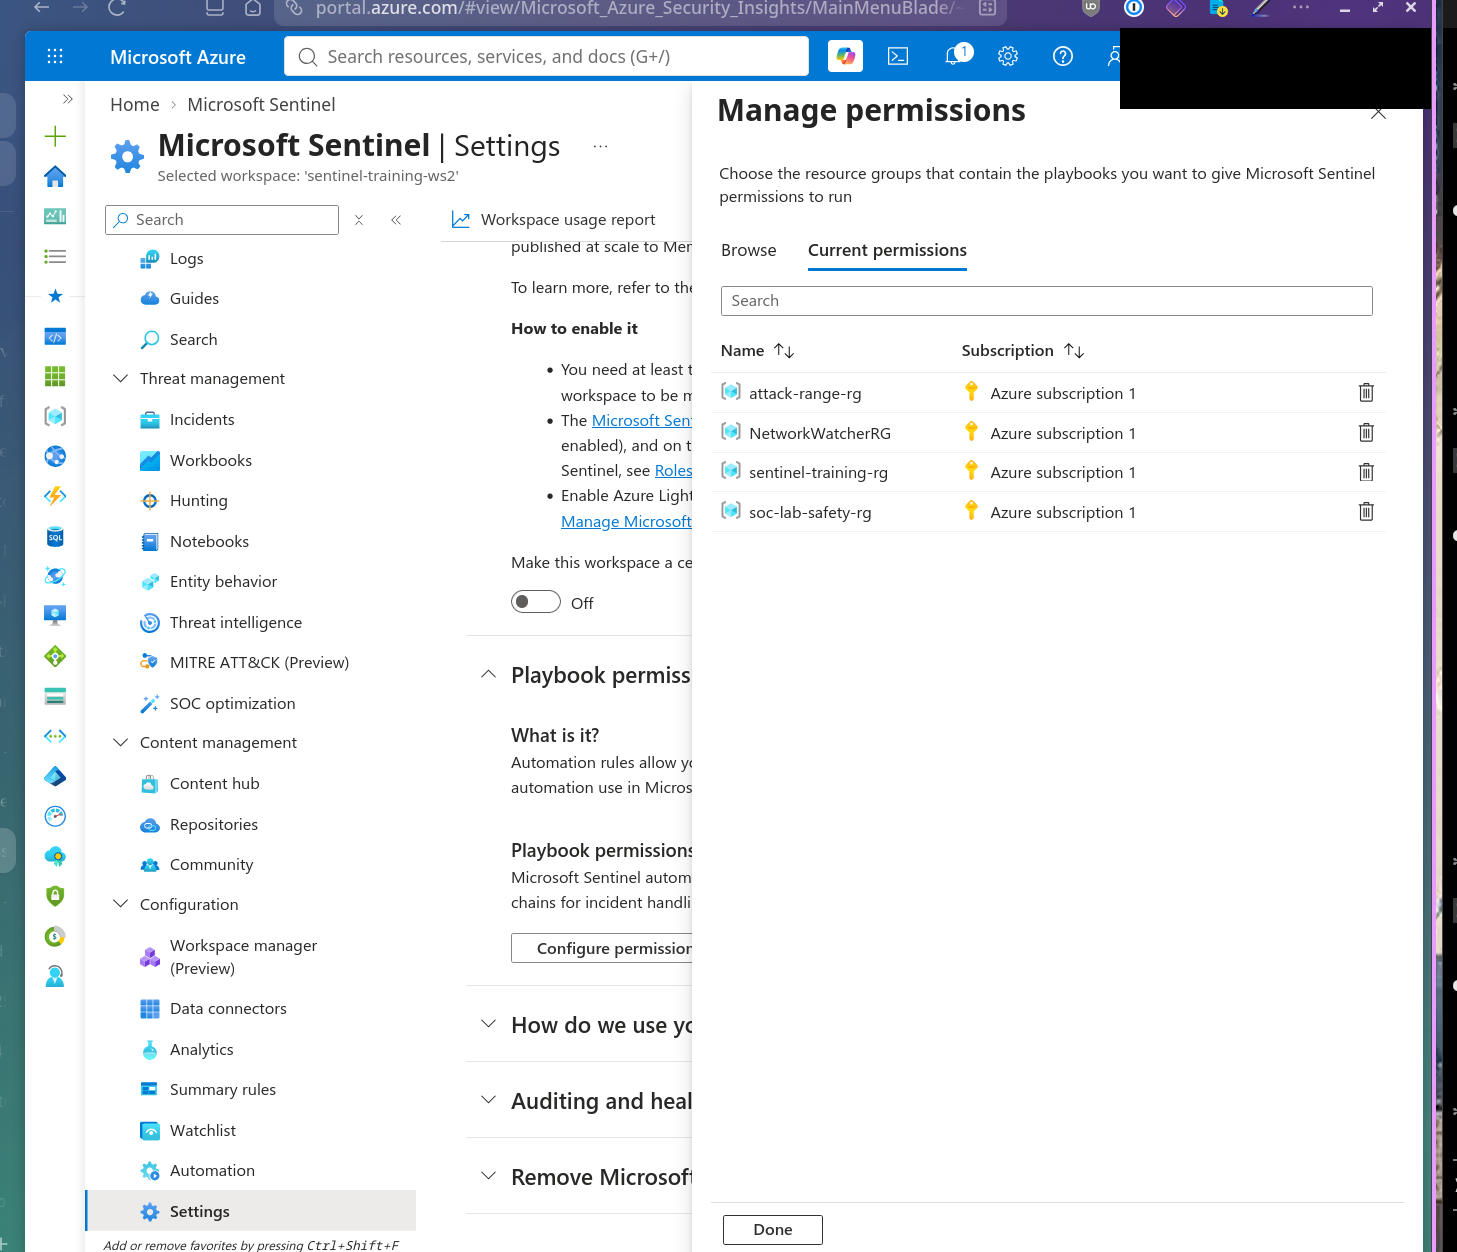 Applying it there — not just in IAM — is what actually unblocked the Automation Rule.
The second wall: a schema three levels deeper than expected
With permissions sorted, the automation ran end to end — but every ServiceNow ticket landed with an empty short_description and description. The HTTP body had used the dynamic-content picker’s Title/Description fields, which resolve to a flat triggerBody()?['Title'] expression.
 Priority landed correctly (
3 - Moderate), which is what narrowed the bug down to those two specific fields rather than the whole integration.
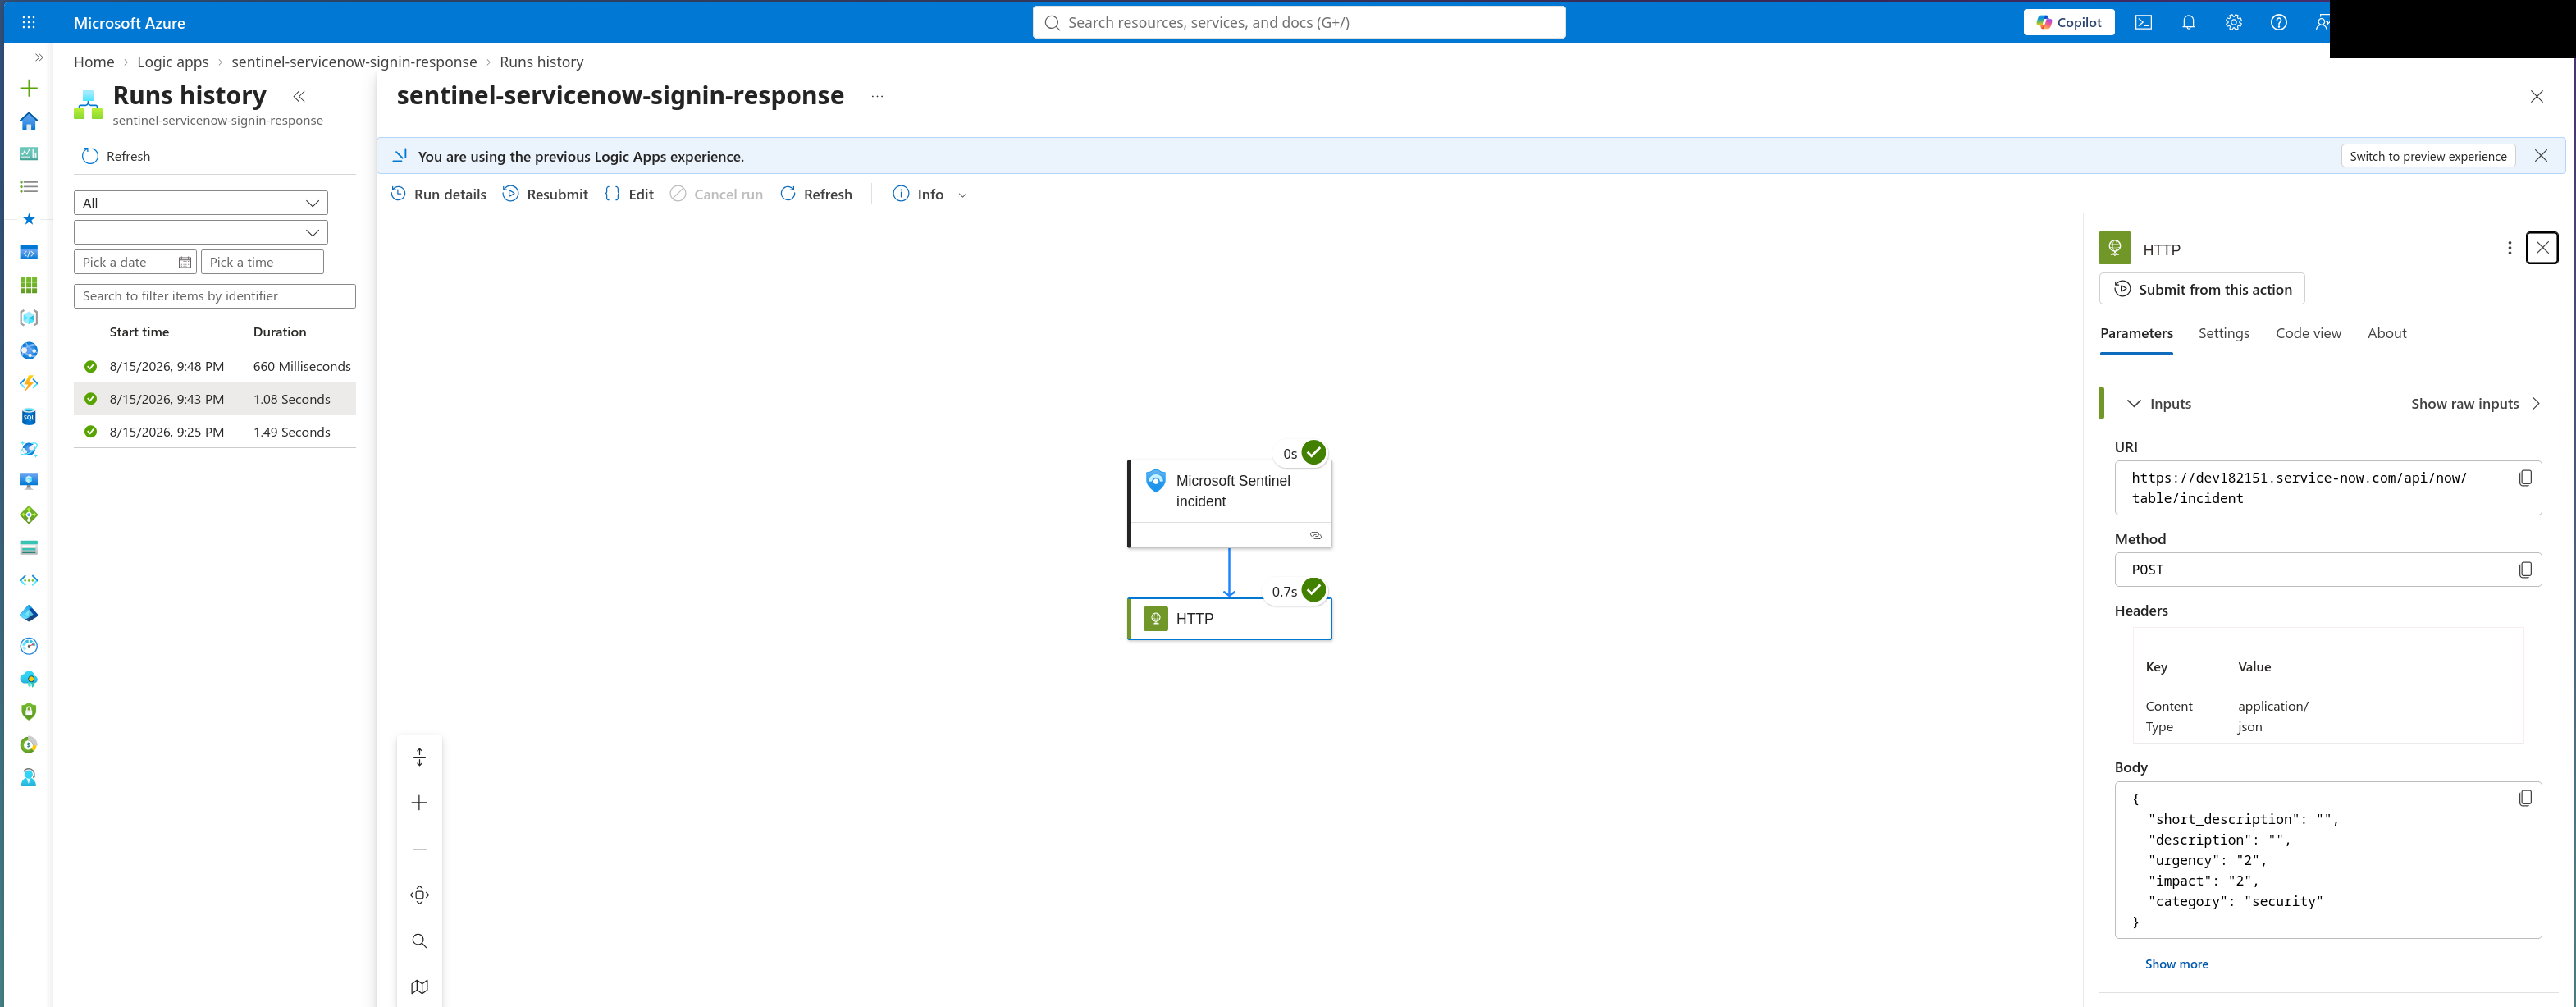 The Logic App’s own record of what it sent confirmed the body was resolving to nothing for exactly those two fields — everything else worked.
Pulling the trigger’s raw output one level up showed the real shape: the incident fields sit under object.properties.title and object.properties.description, not at the top level.
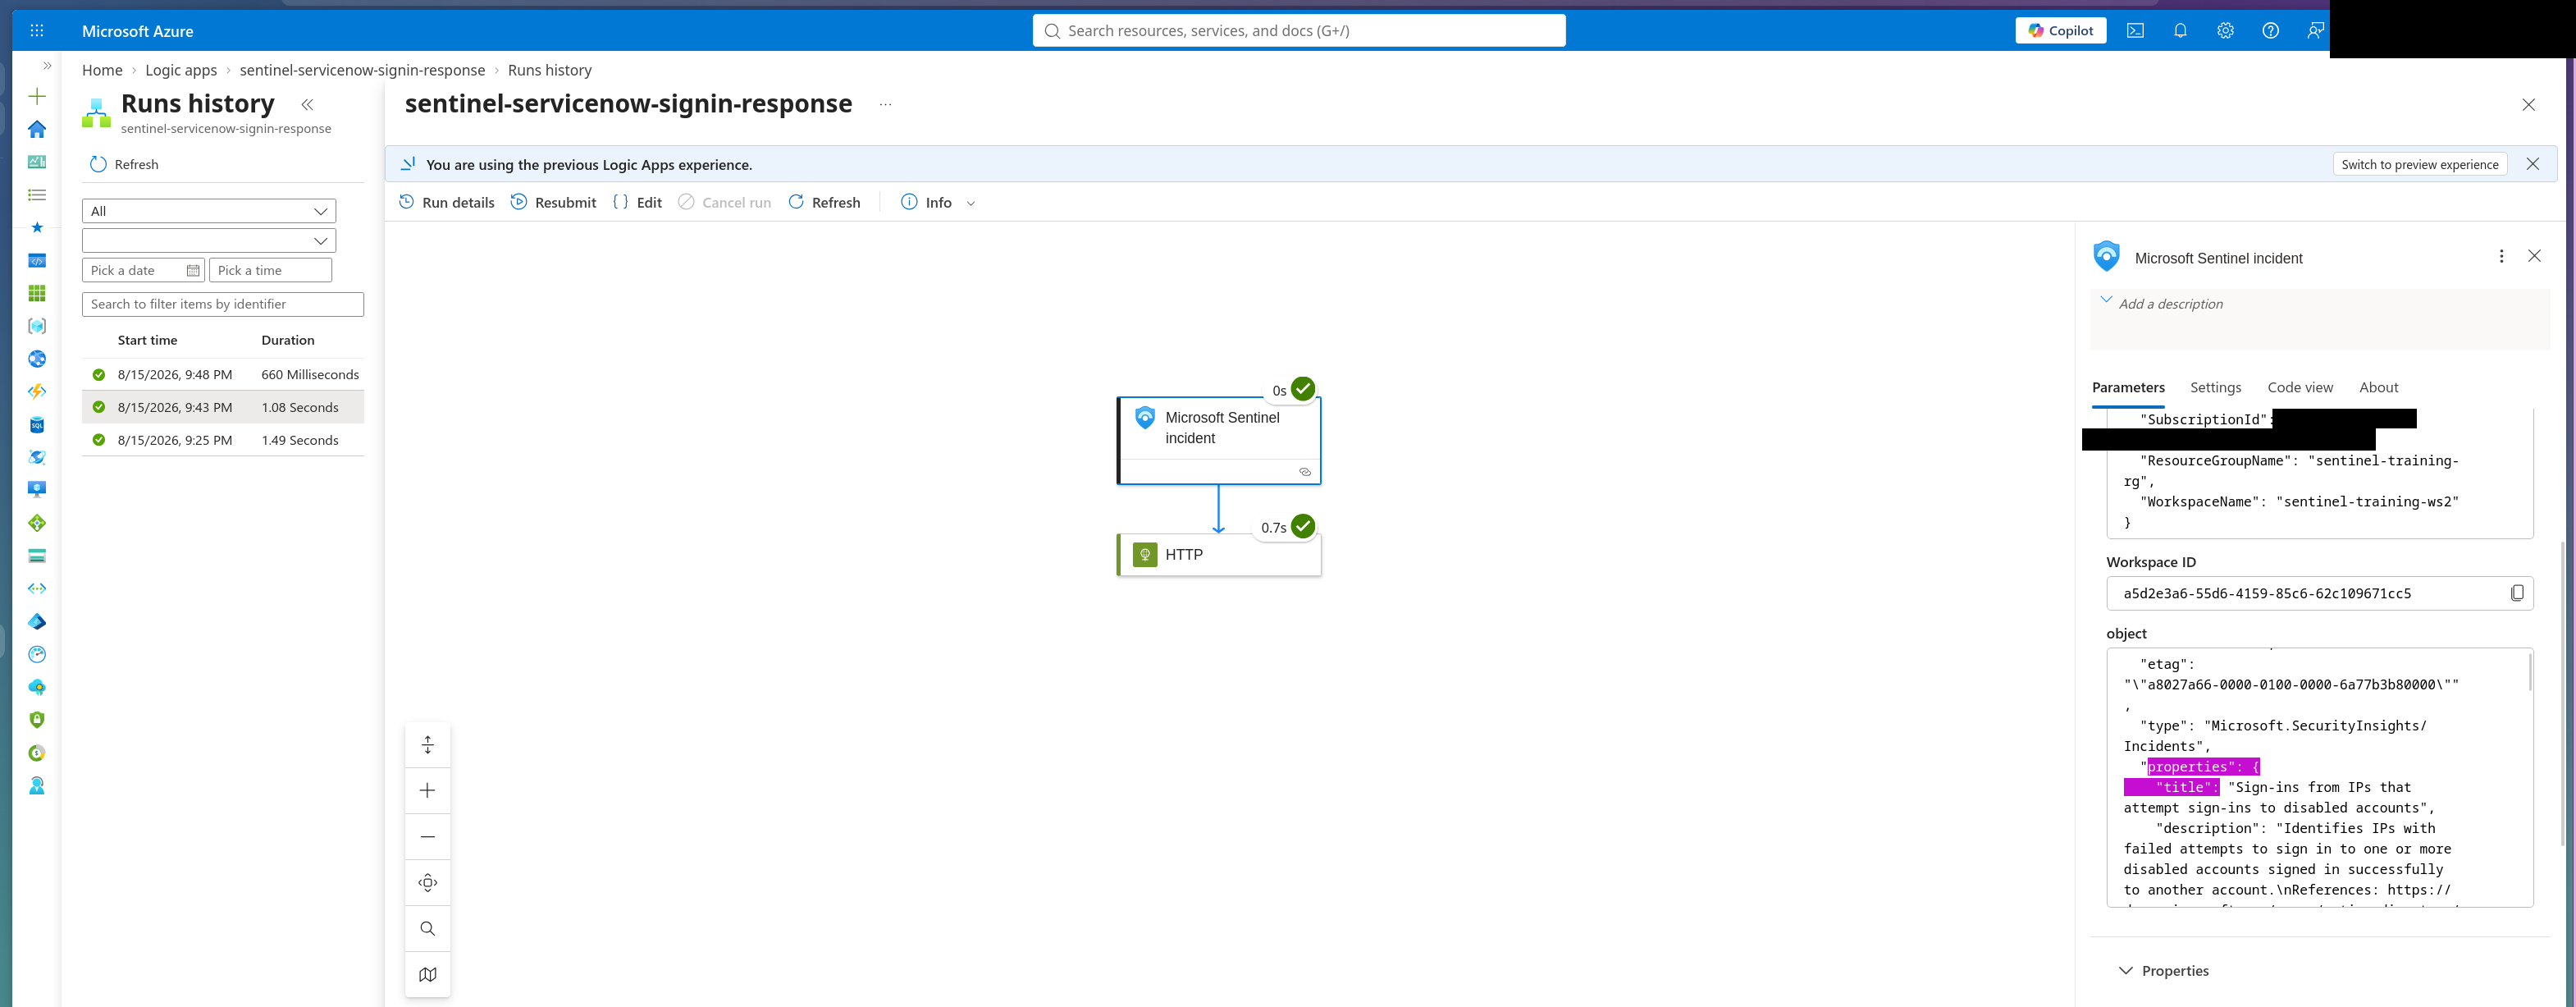
triggerBody()?['object']?['properties']?['title']
triggerBody()?['object']?['properties']?['description']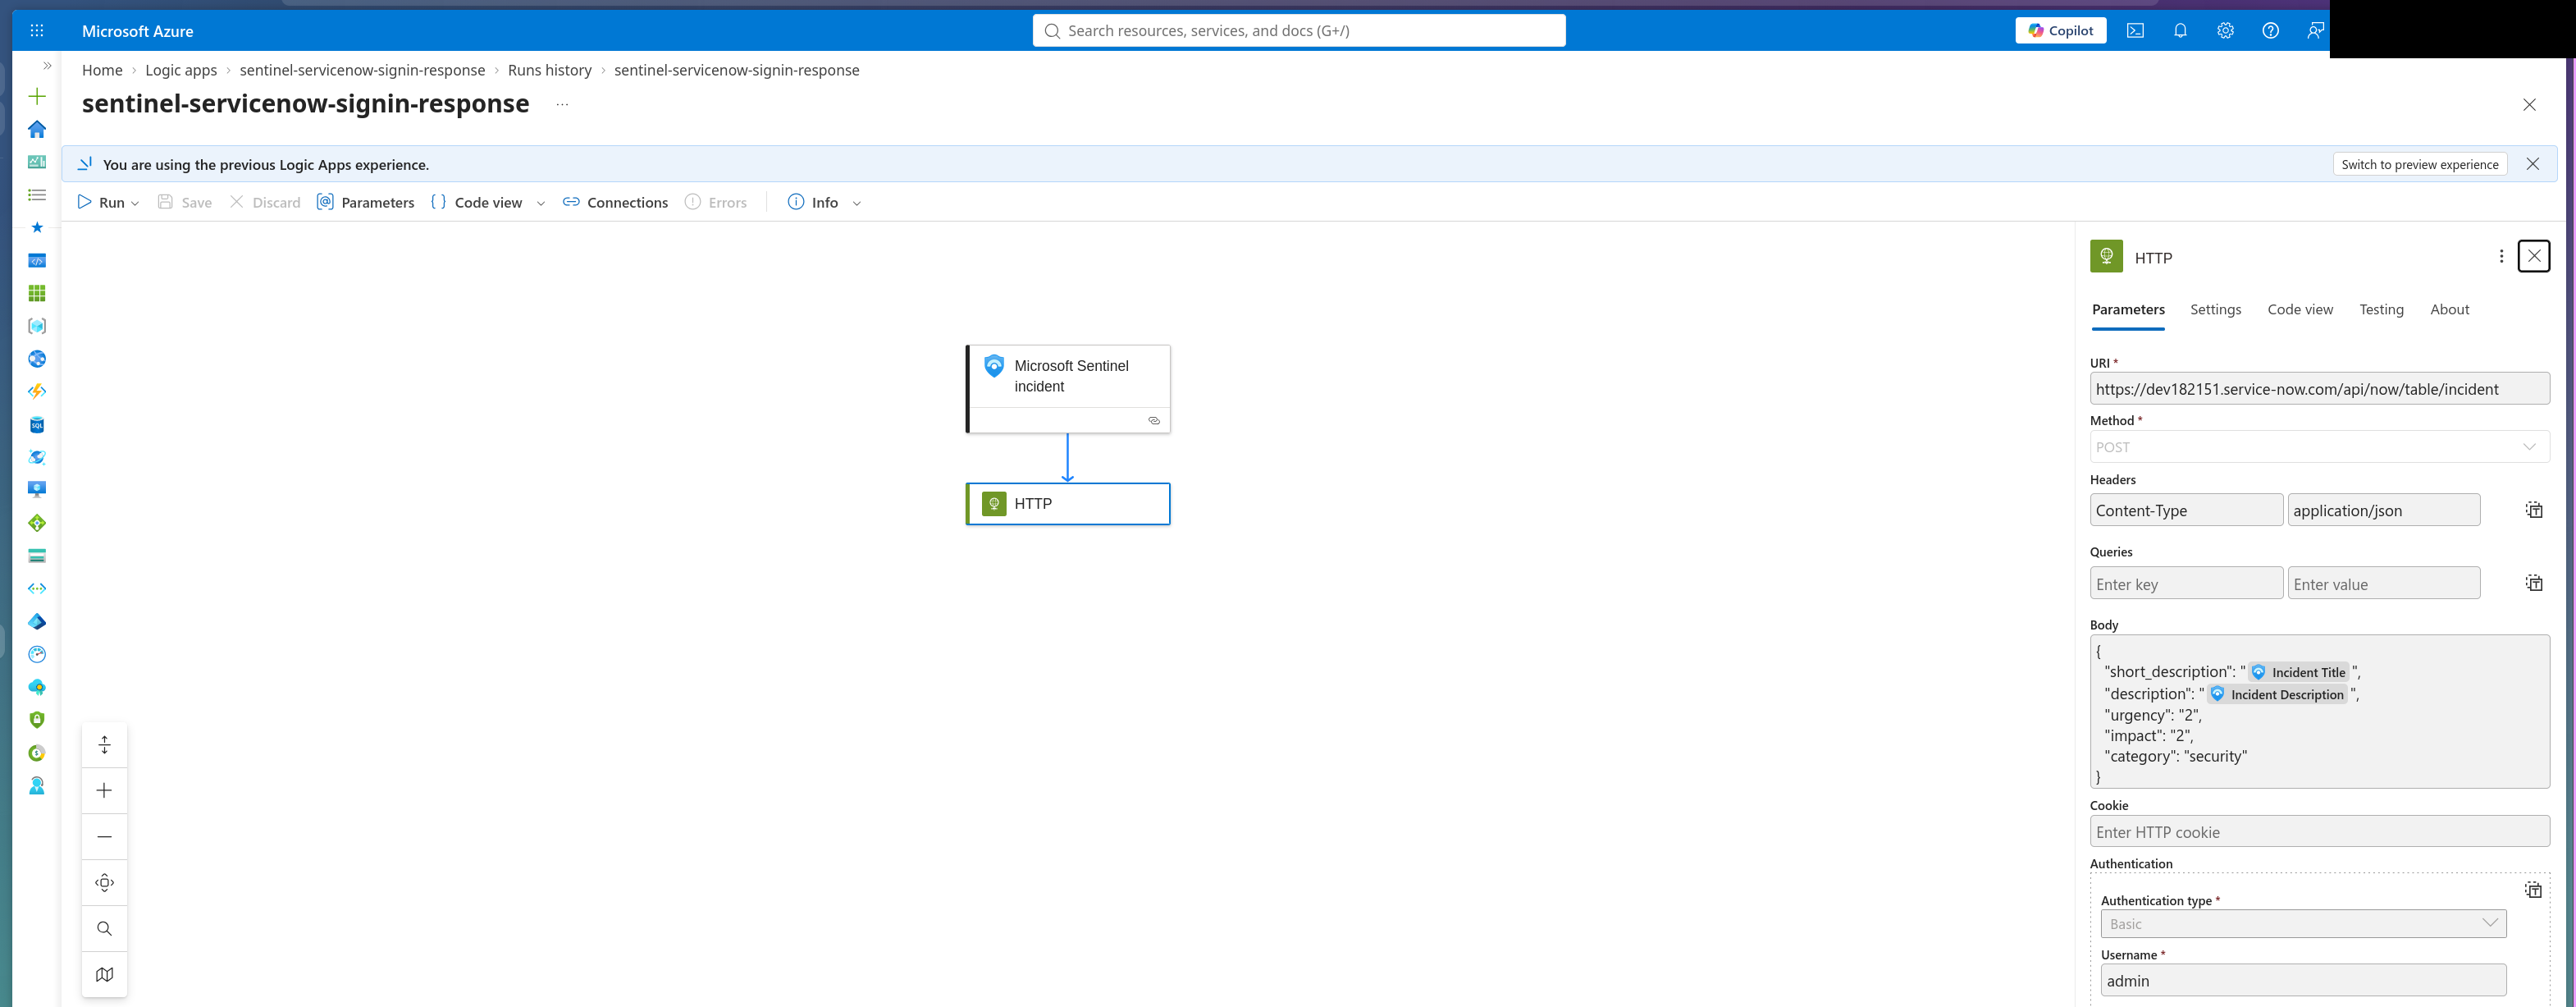 The corrected expression, properly bound to the dynamic-content chips this time.
Closing the loop
The Automation Rule ships with a trigger (incident created), a condition (analytic rule name matches the sign-in detection), and a single action — run the playbook. No auto-close action was added deliberately: the point was to hand off to ServiceNow for a human to triage, not to let Sentinel silently resolve its own incidents.
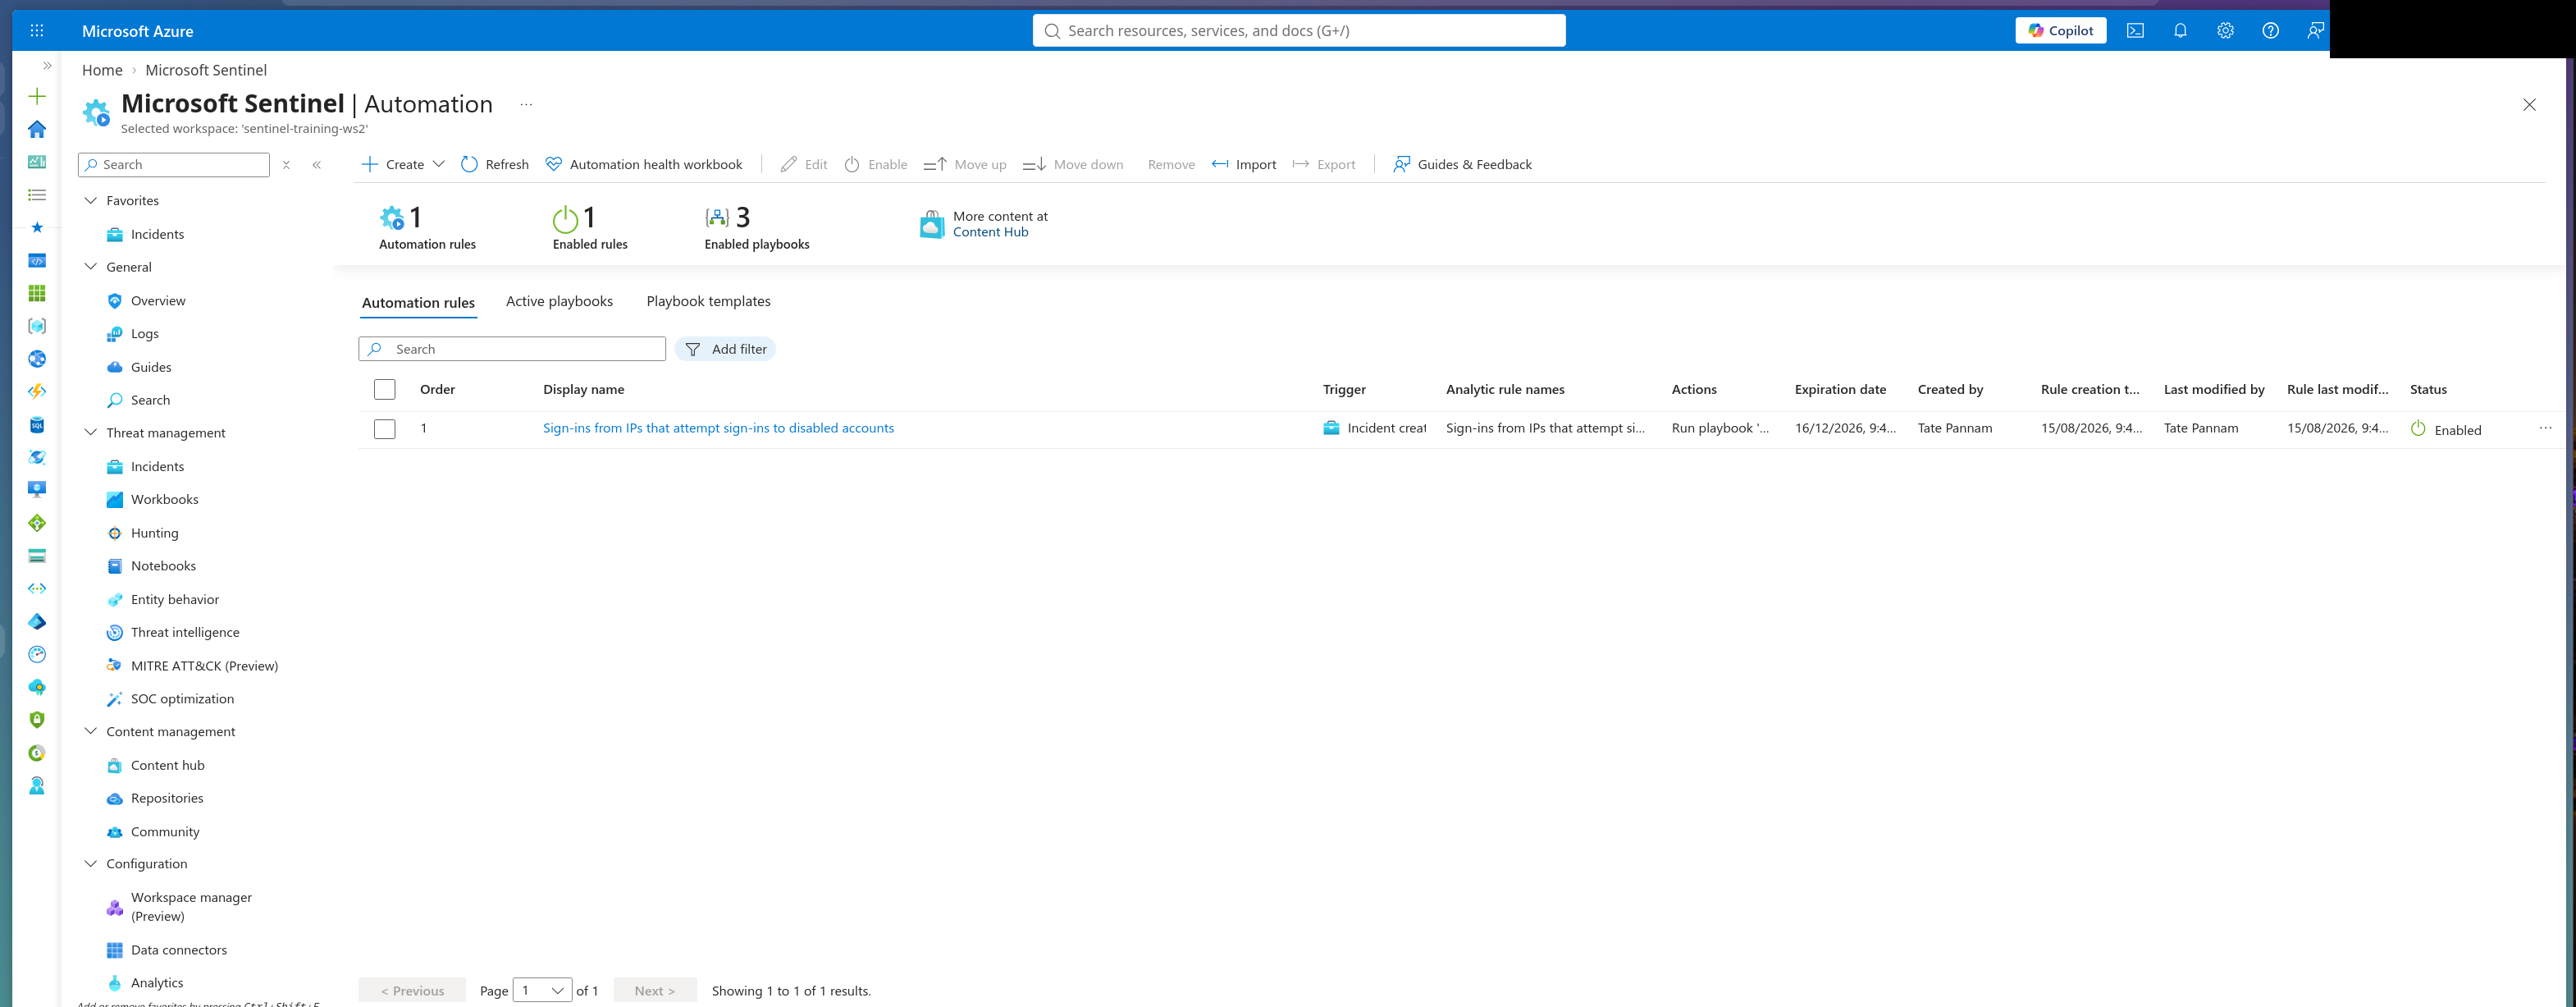 One trigger, one condition, one action — deliberately minimal.
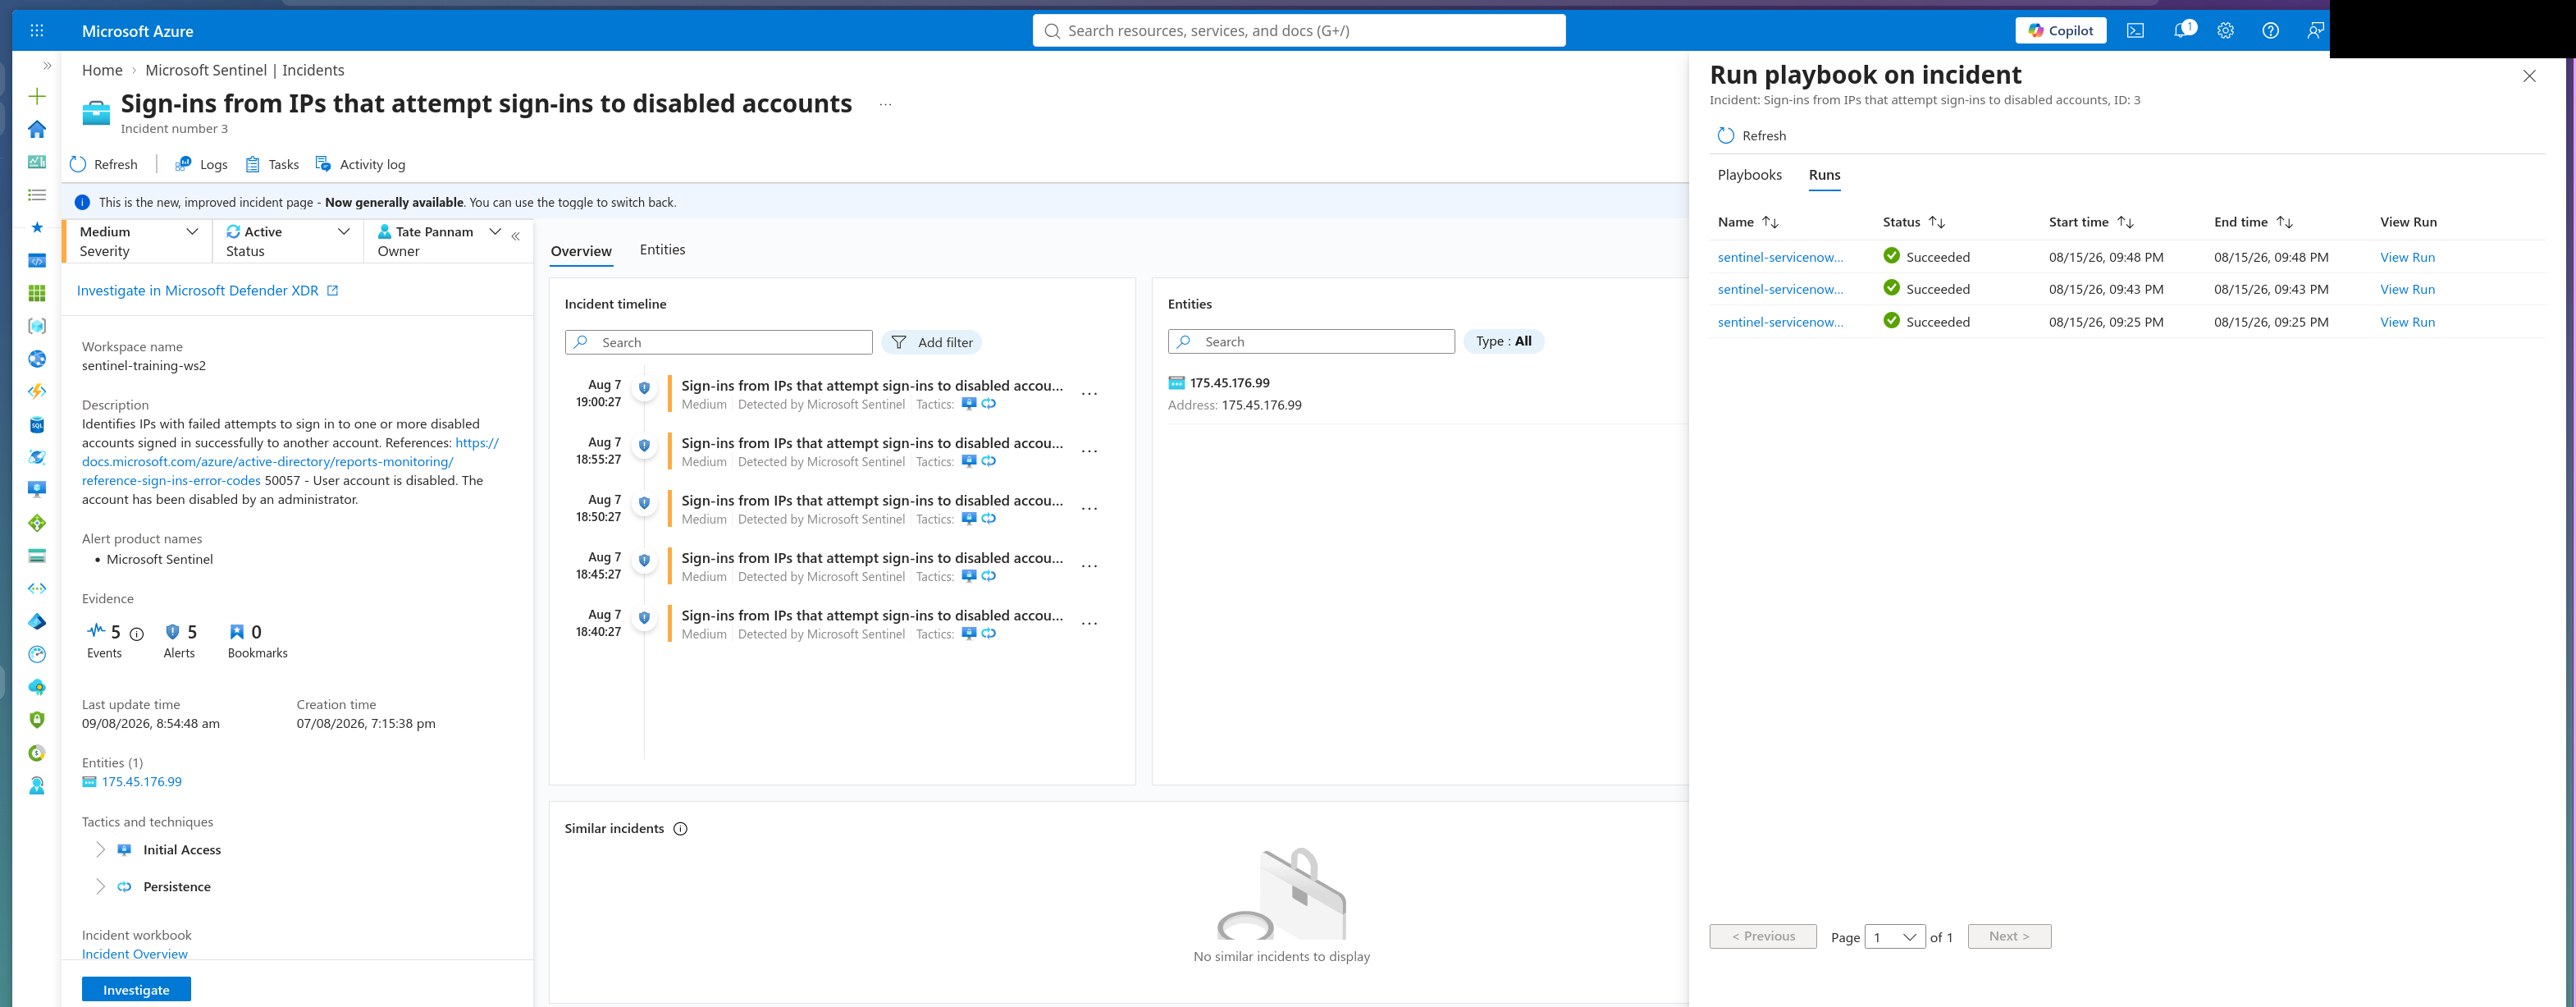 A clean run against the real incident, both steps succeeding end to end.
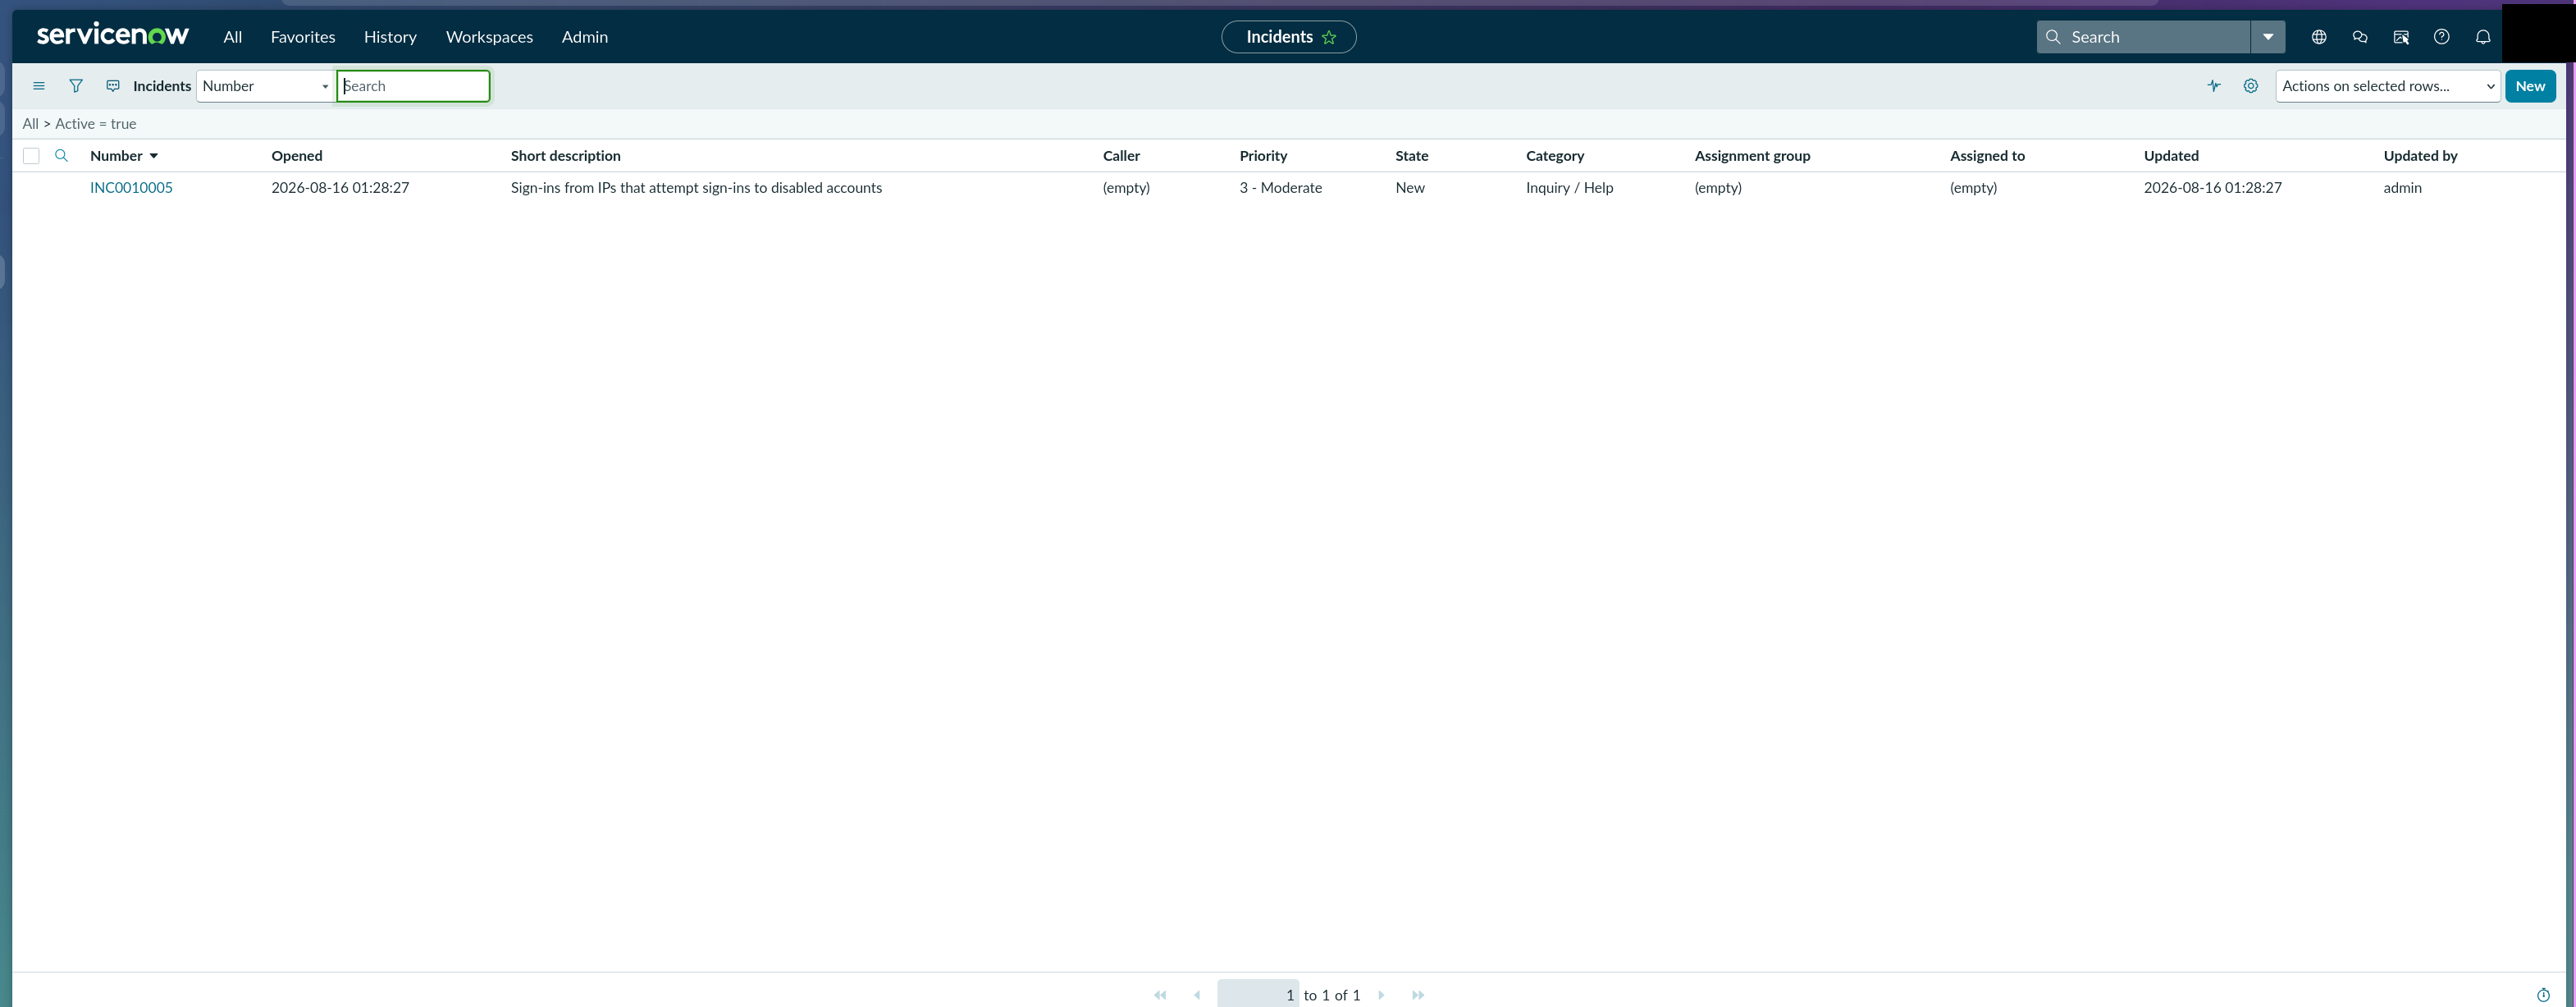 And the ticket it produced — real title, real description, sitting in the queue exactly where an analyst would expect it.
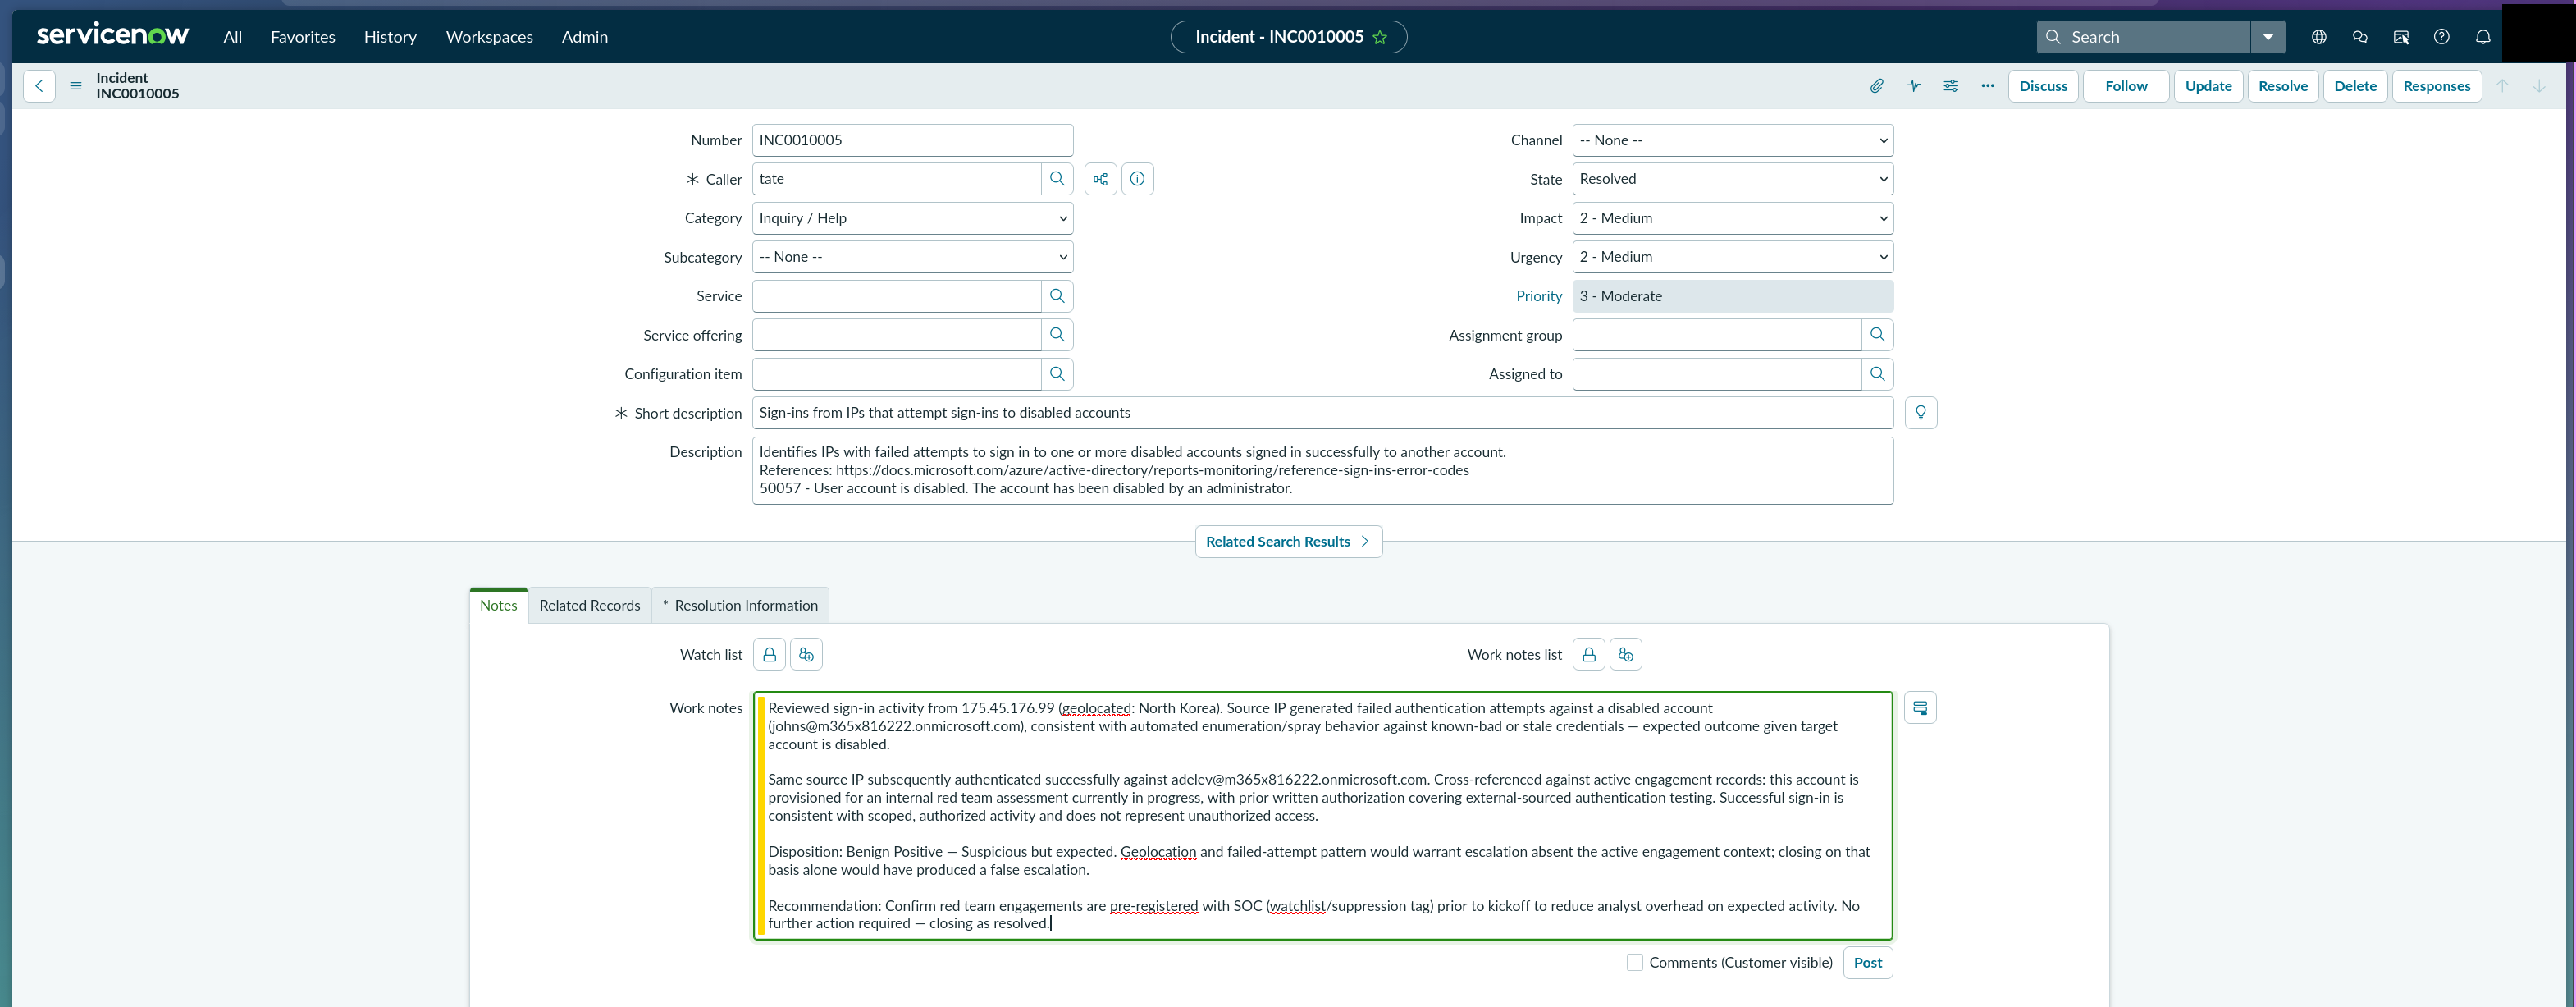 Assigned, triaged with a work note, and resolved — the closed loop the whole build was aimed at.
Part 3 — The Noisy Range: Atomic Red Team at Volume
Where the training lab proves the automation works on one specific detection, the custom range proves the workspace can hold up under realistic alert volume and variety. Atomic Red Team executions against the domain controller and Windows workstation, observed from the Kali box, generated well over a hundred incidents across a broad technique spread inside 24 hours.
Distinct detections observed: Mass File Rename Detection (Ransomware Pattern), Network Discovery Detection, Suspicious PowerShell Execution Detection, Credential Dumping Detection, Linux Attack Activities Detection, Enhanced Credential Access Detection, Security Event PowerShell Empire, Process Discovery Activities Detection, Cross-Platform Attack Detection, Registry Run Key Persistence Detection, Suspicious Scheduled Task Creation, Multi-Persistence Detection.
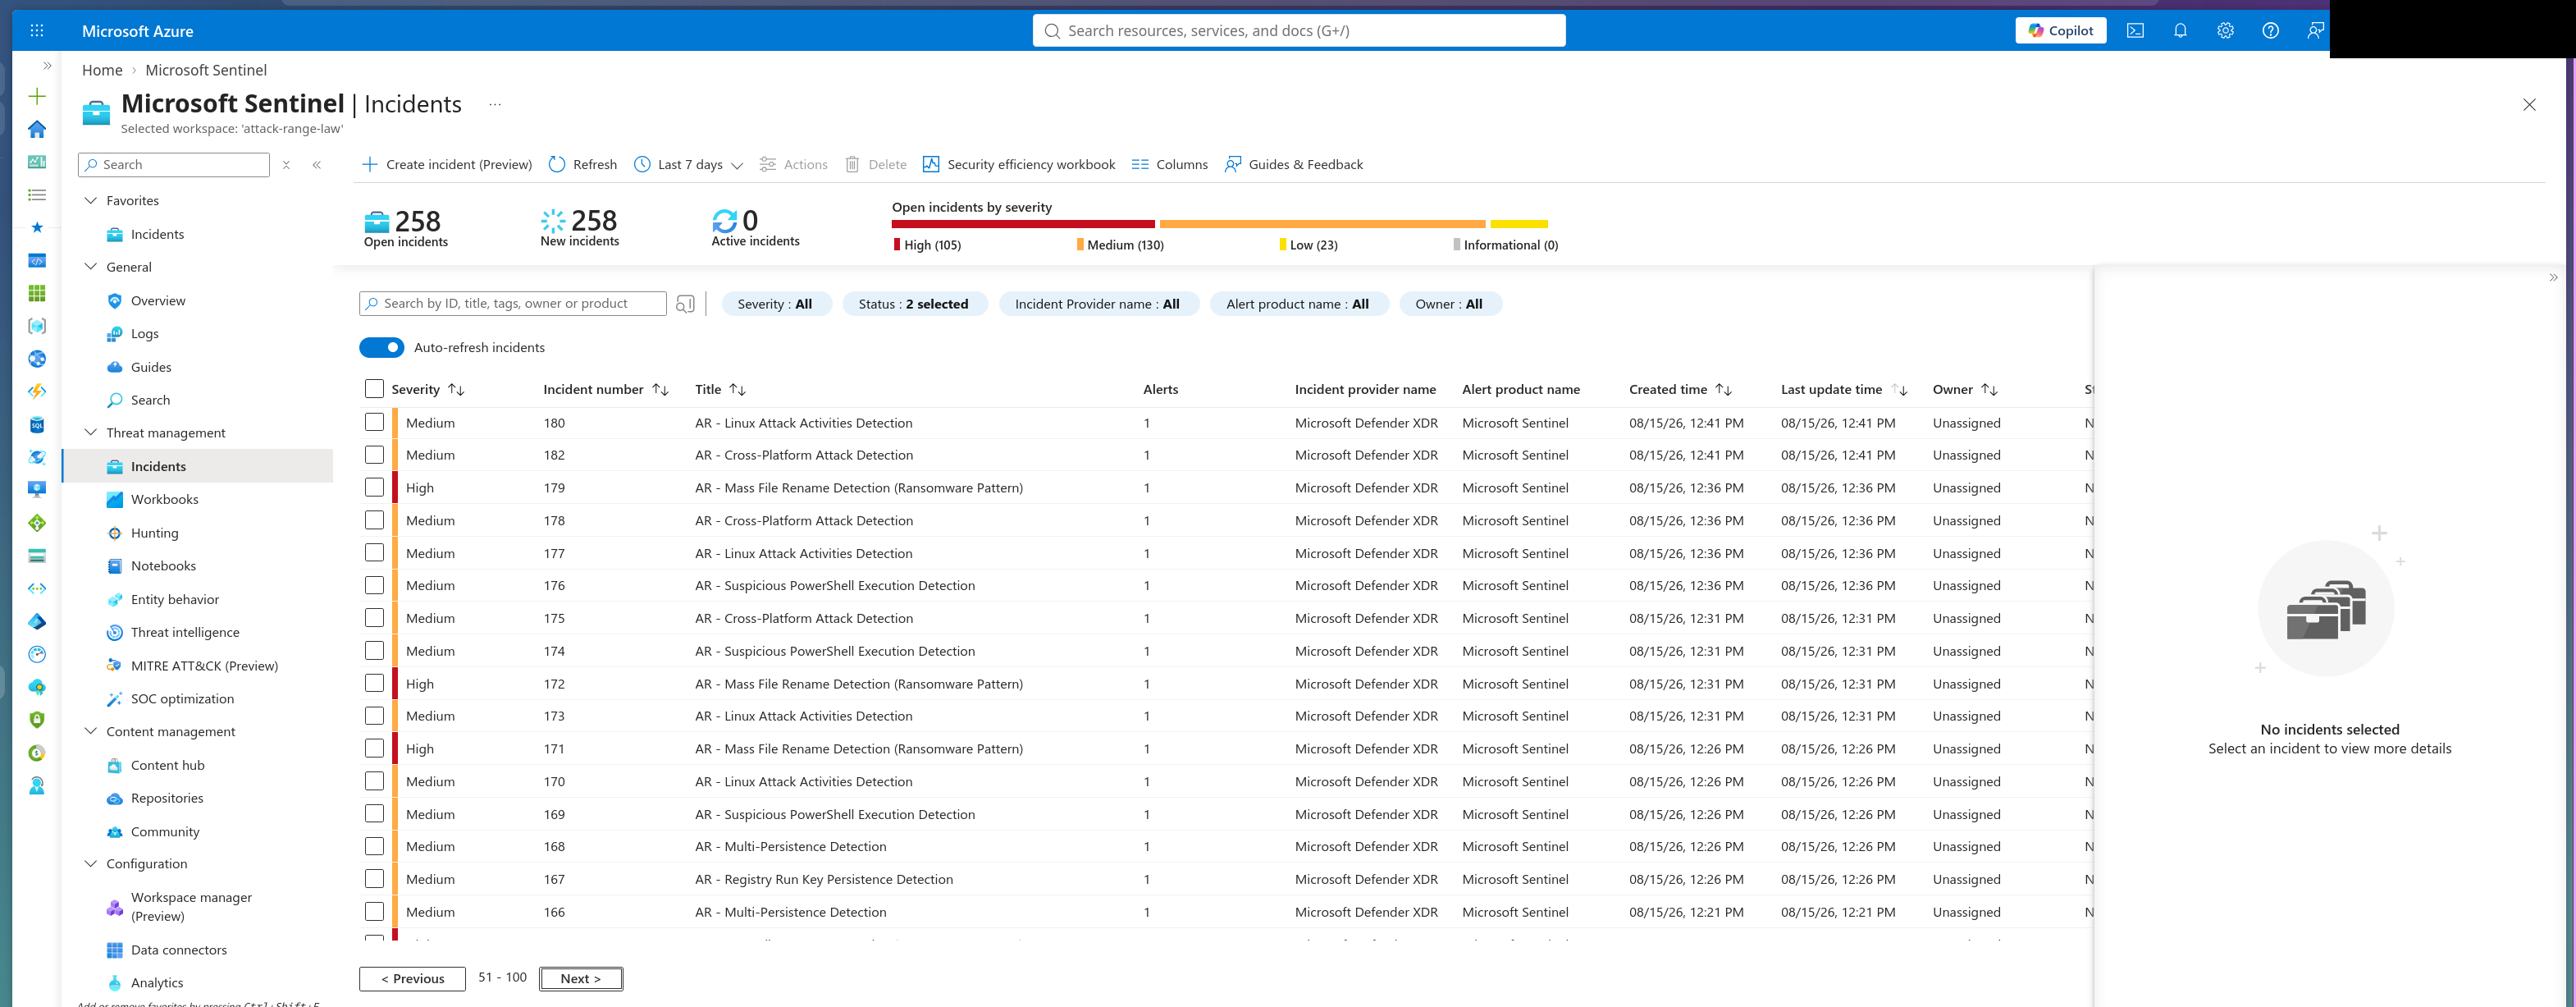 258 open incidents at the wide-angle view — High 105, Medium 130, Low 23.
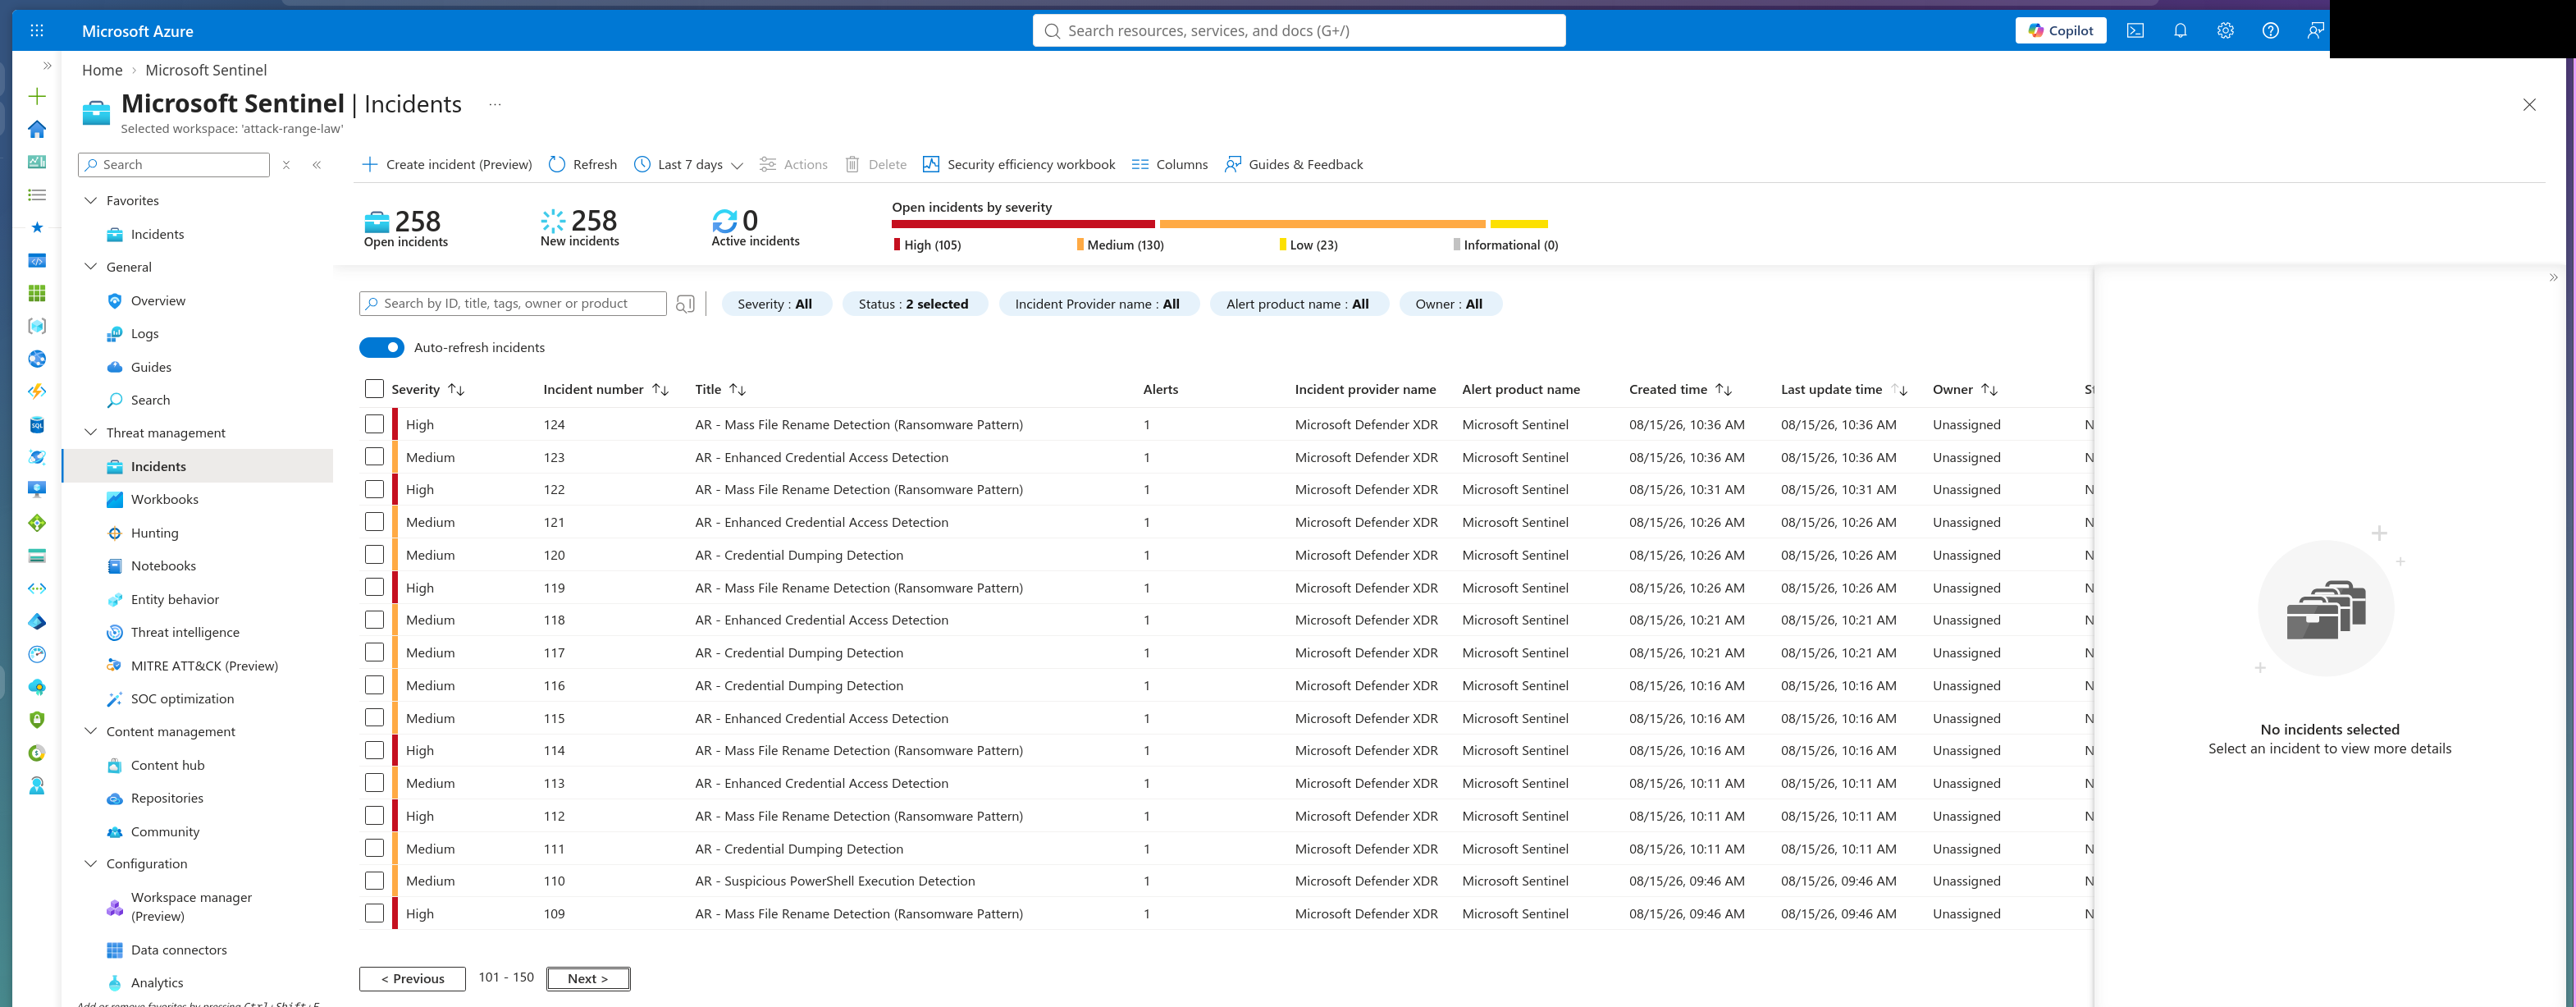 A second page of the same queue, the catalog variety visible across a dozen distinct
 AR - detection names rather than one rule firing on repeat.
Deep dive: Mass File Rename Detection (Ransomware Pattern)
Built on Sysmon Event ID 11 (FileCreate), the rule watches for a high-volume burst of file-create events from a single process on a single host inside a five-minute window — the signature shape of ransomware mass-encrypting/renaming, without needing to fingerprint any specific family. Native Windows auditing doesn’t capture individual file operations at this granularity, so Sysmon is the actual dependency the whole detection rides on.
SecurityEvent
| where EventSourceName == "Microsoft-Windows-Sysmon"
| where EventID == 11
| extend TargetFilename = extract(@'TargetFilename\">([^<]+)', 1, EventData)
| extend Image = extract(@'Image\">([^<]+)', 1, EventData)
| extend FileExtension = tostring(split(TargetFilename, ".")[-1])
| extend ProcessName = tostring(split(Image, '\\')[-1])
| summarize FileCount = count() by ProcessName
The incident’s own logs confirmed two processes crossing the threshold — svchost.exe and mousocoreworker.exe — each tied to a distinct sample-file set, both consistent with the rule’s ransomware-pattern framing rather than a one-off noisy process.
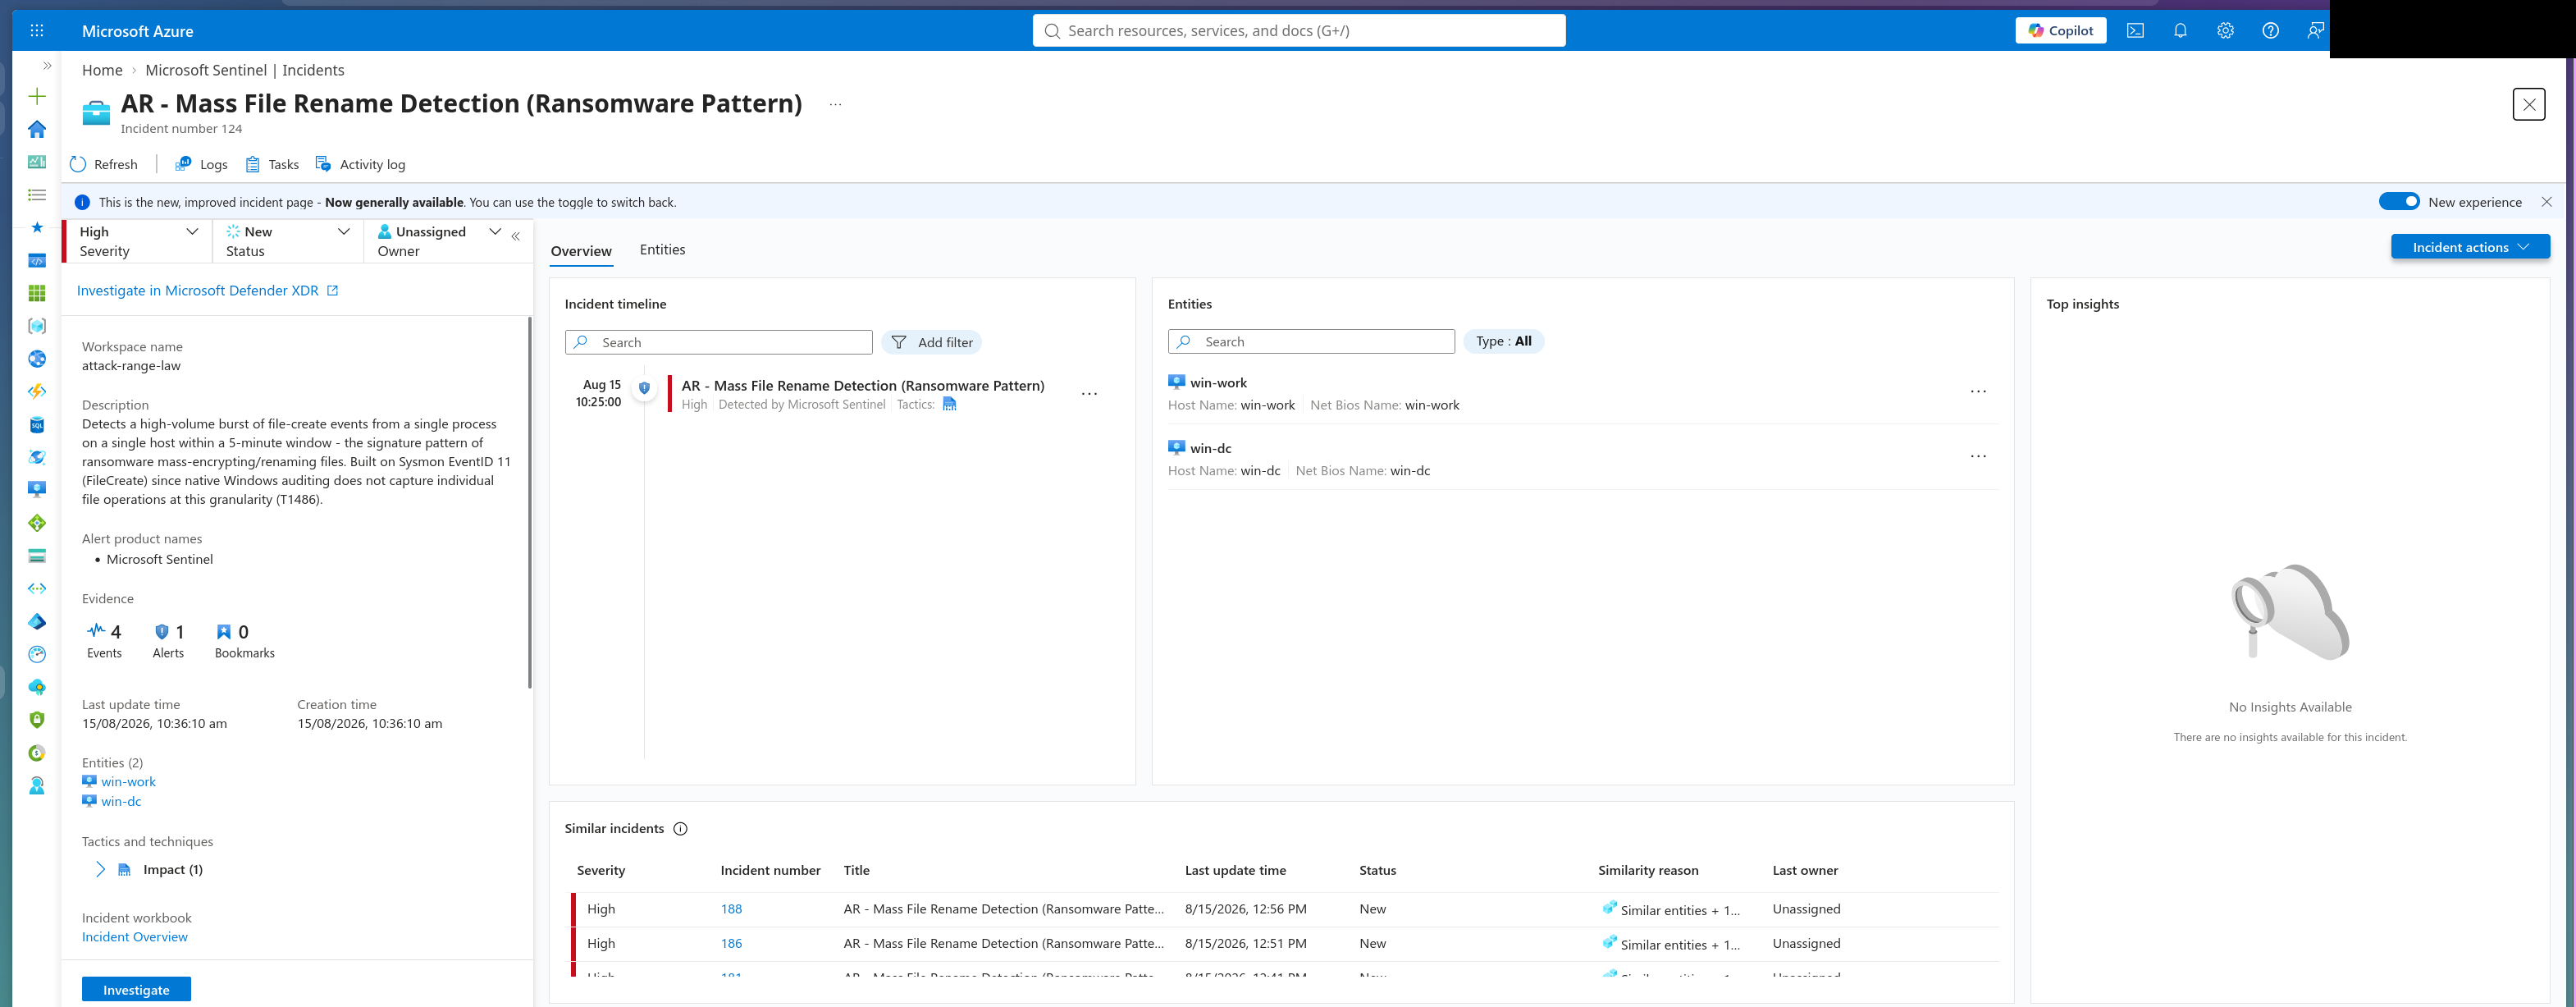 The incident overview — entities, evidence count, severity, tactics.
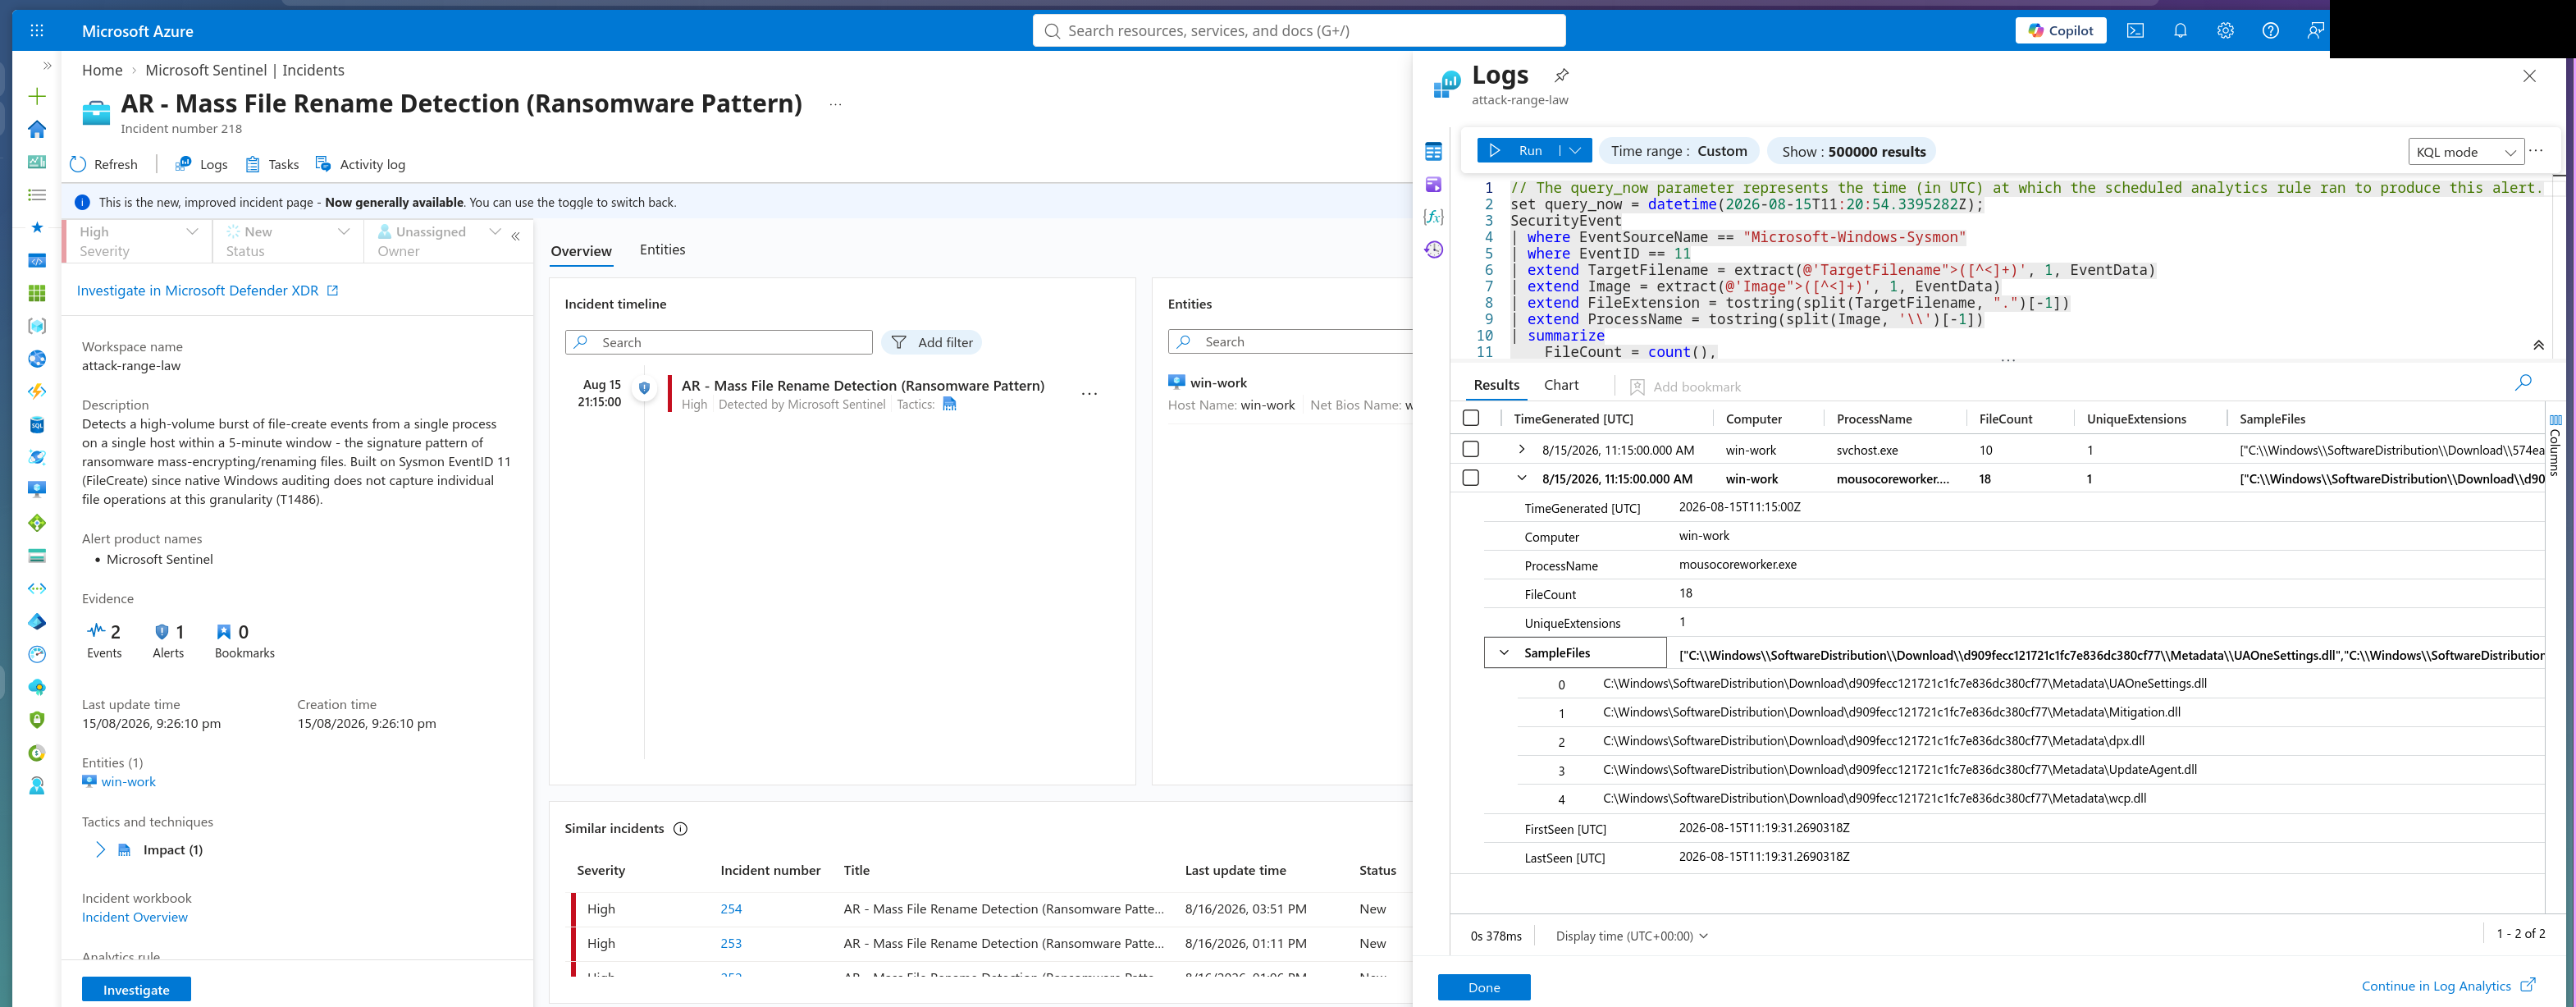 And the Logs panel behind it, the query above running against the real data,
 FileCount broken out per process.
Second automation strand: Credential-access enrichment
Where the ServiceNow pipeline in Part 2 hands an incident off to a human, pb-credential-dump-enrichment (built earlier in attack-range-rg) does the opposite job: it enriches the incident in place before a human ever opens it, so triage starts with the answer already half-assembled instead of from a blank alert. The Automation Rule tying it to Sentinel scopes it to a specific analytic rule — Enhanced Credential Access Detection — not Credential Dumping Detection generally, which only became clear when it wouldn’t fire against a Credential Dumping incident and did fire cleanly against this one.
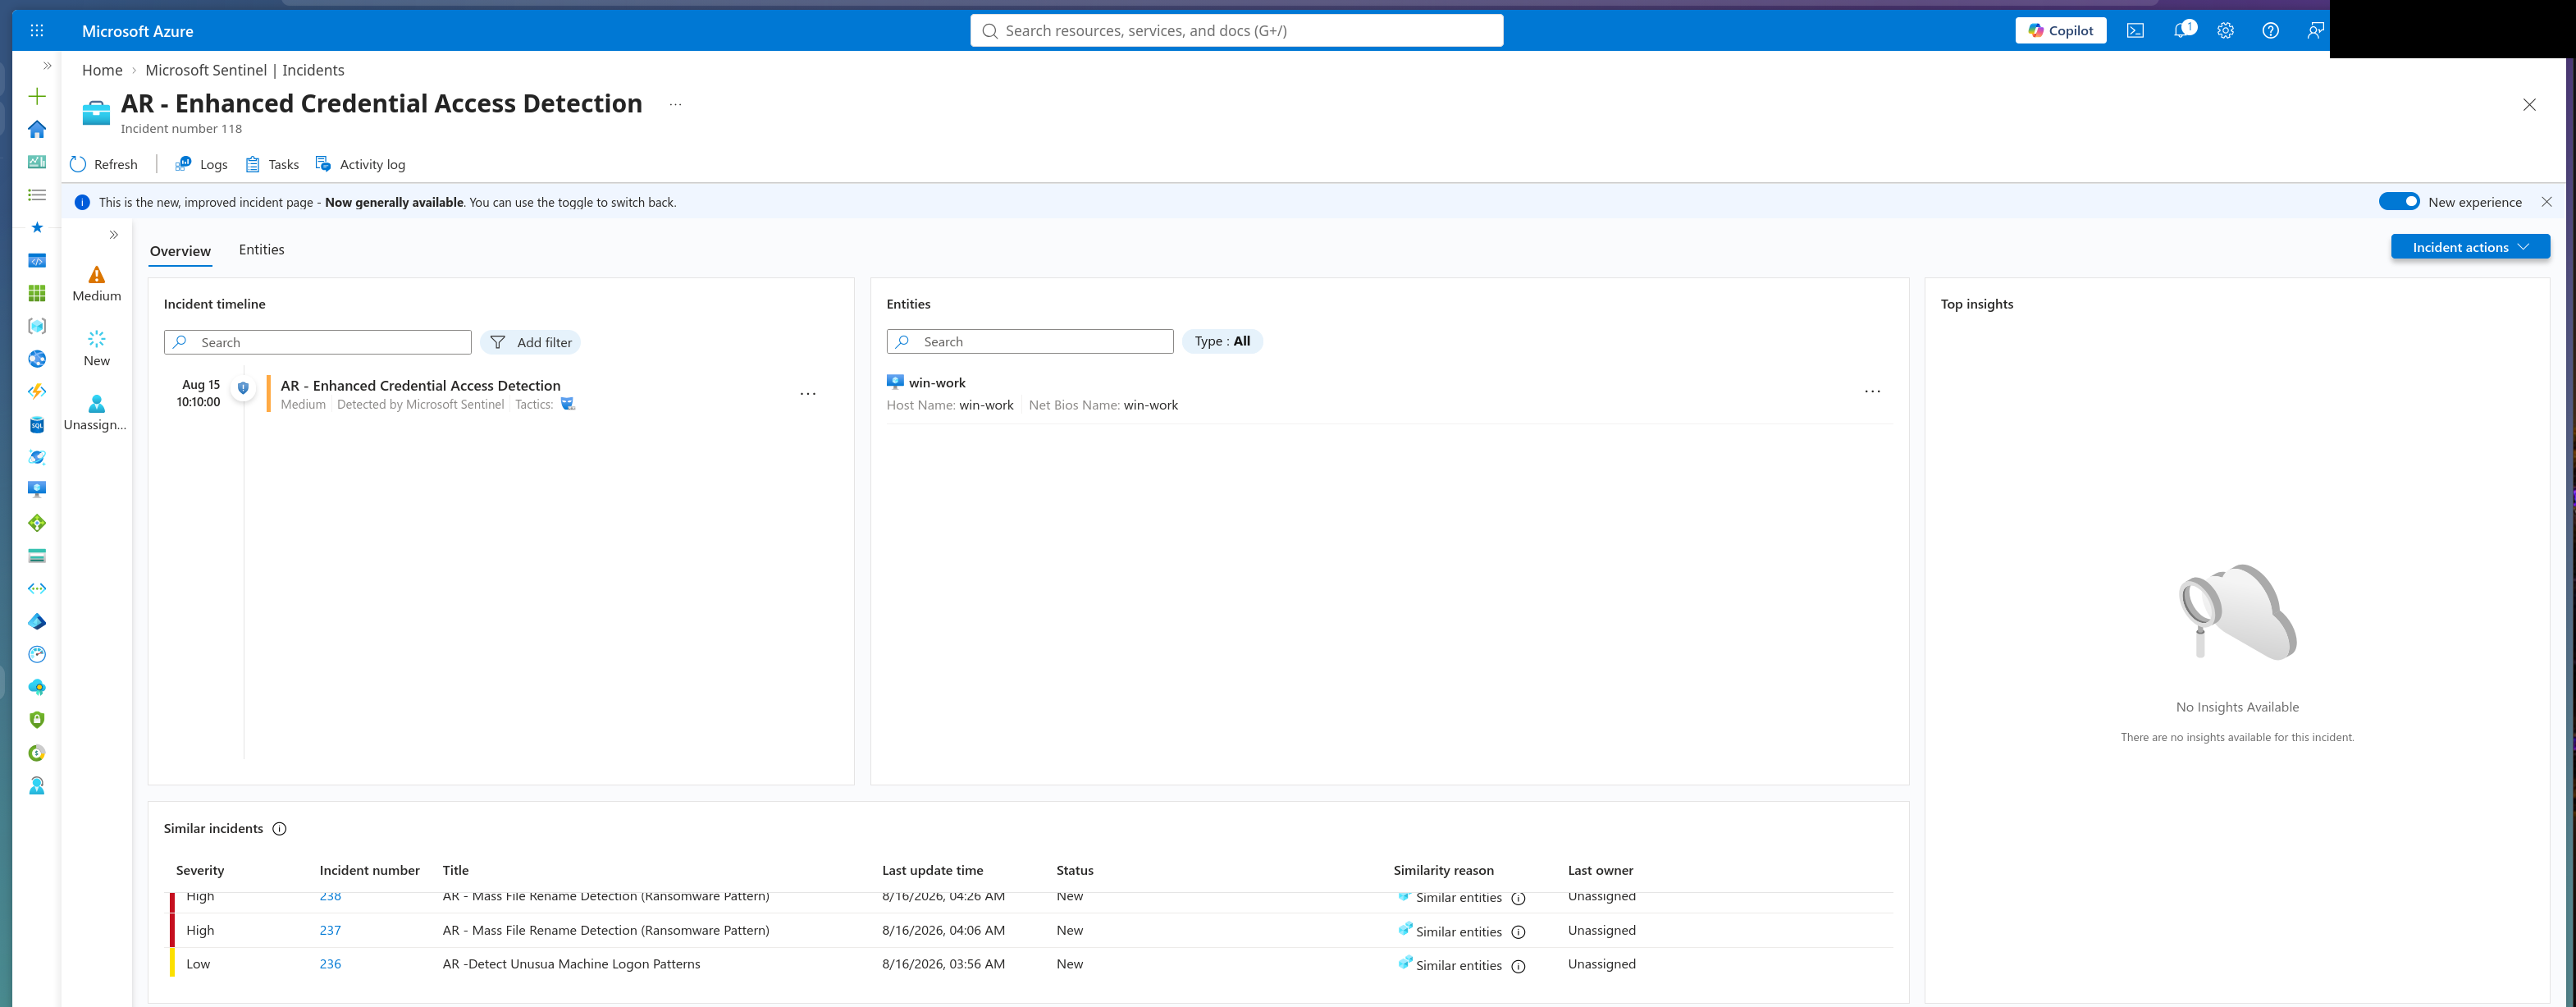 The starting point: no insights, no comment — the raw incident the playbook works from.
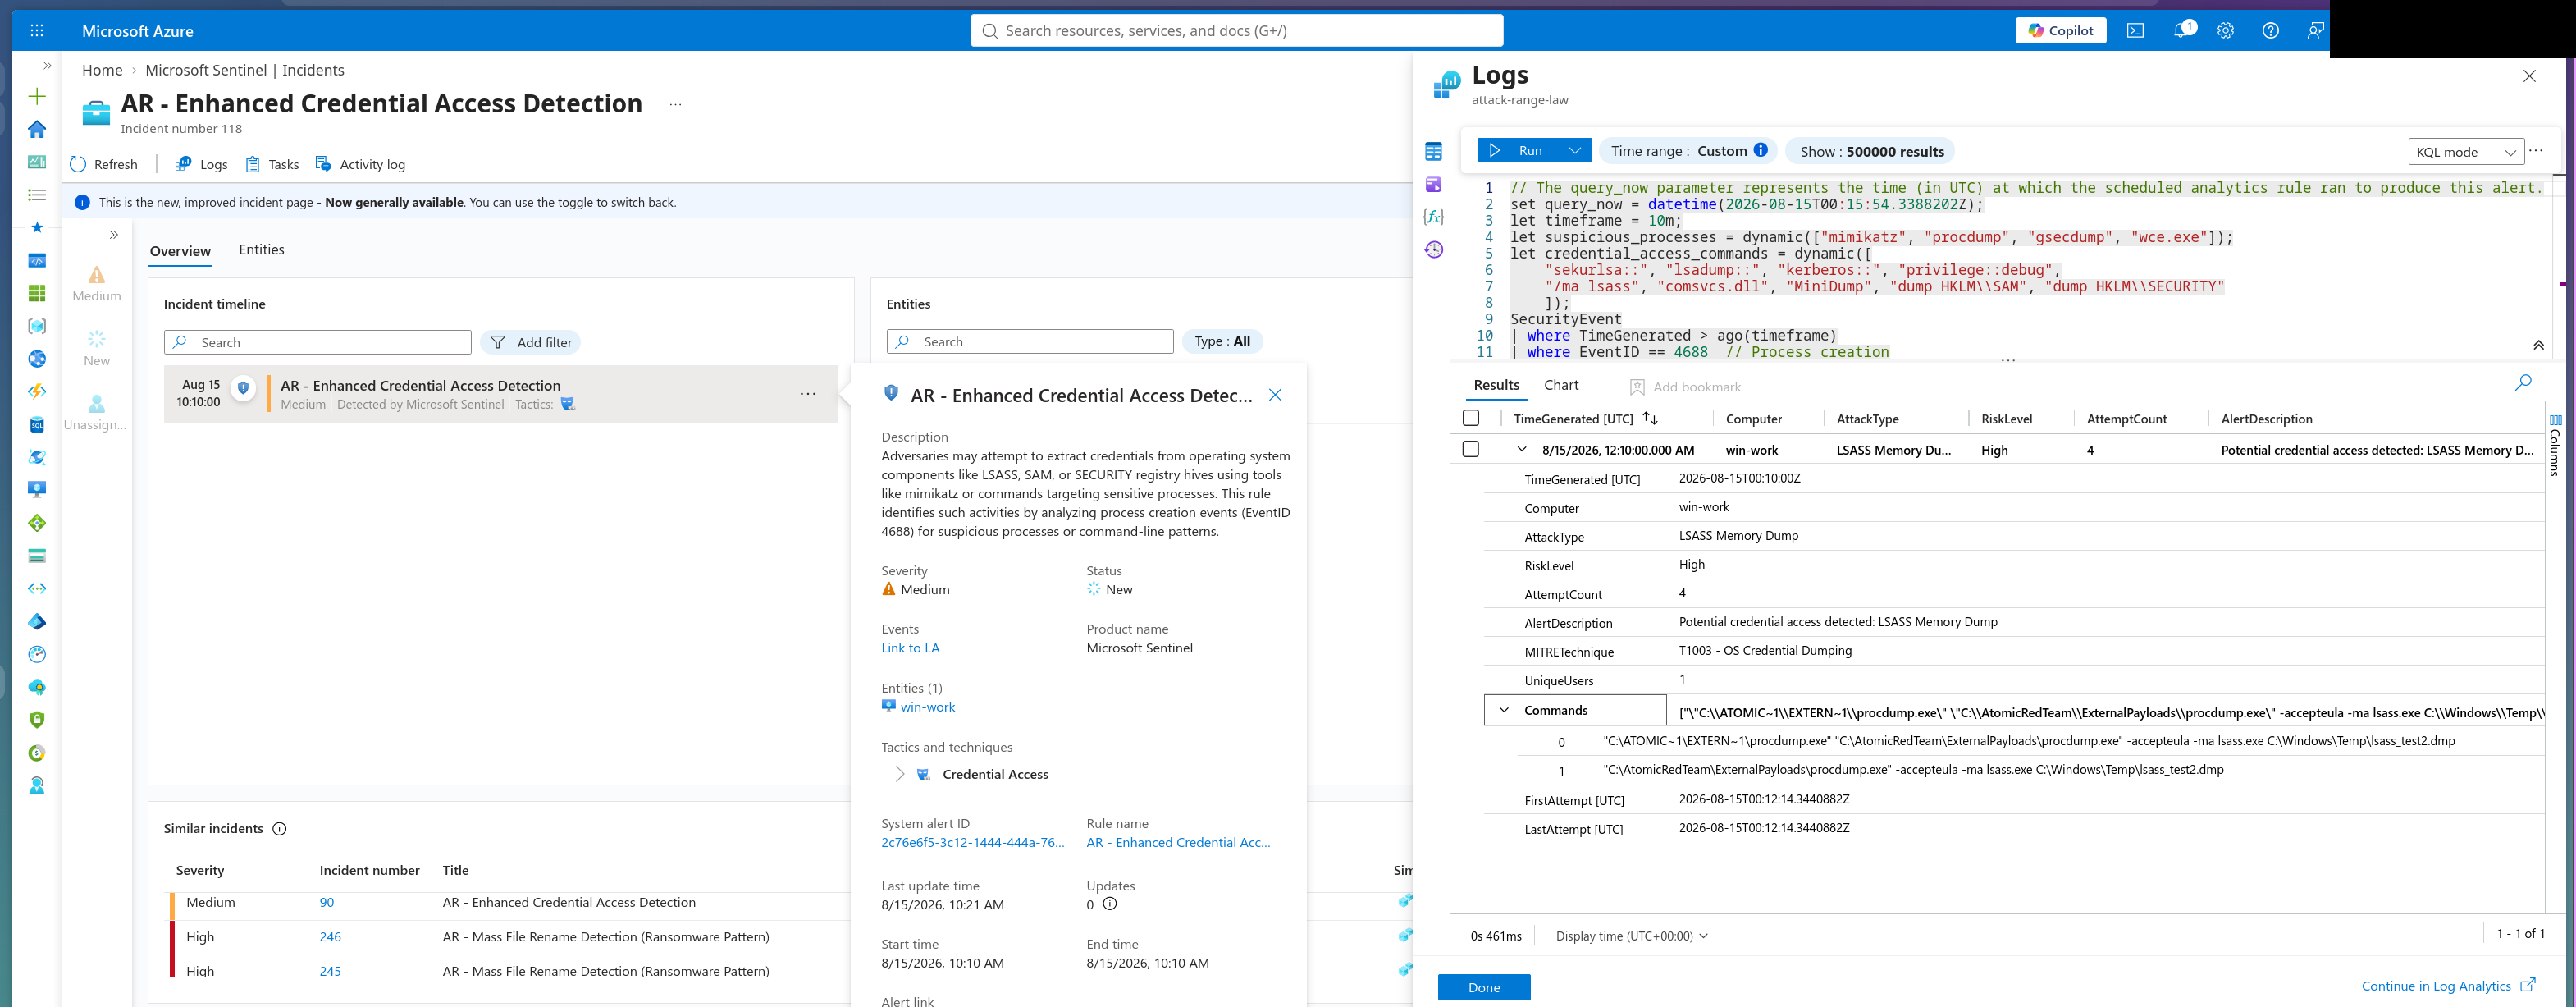 The detection’s own logic, matching on known credential-dumping command lines and Mimikatz sub-commands — this is what actually put the incident in the queue in the first place.
The playbook’s real shape, pulled straight from the designer: the Sentinel incident trigger feeds an Entities - Get Hosts step, composes the hostname and a time window, then runs three KQL queries in parallel against that window — Query FileCreate, Query LSASSAccess, Query ProcessCreate — before composing a SHA256 hash from whatever the process query turned up. A Condition HasHash branch decides what happens next: if a hash was found, a VT Lookup action (GET https://www.virustotal.com/api/v3/files/{hash}, authenticated via a secured vtApiKey header parameter) checks it against VirusTotal and composes a verdict; either way, everything collected — host, process command line, account, SHA256, VirusTotal verdict, LSASS access confirmation, dump file evidence — gets assembled into one HTML block and posted back to the incident as a comment.
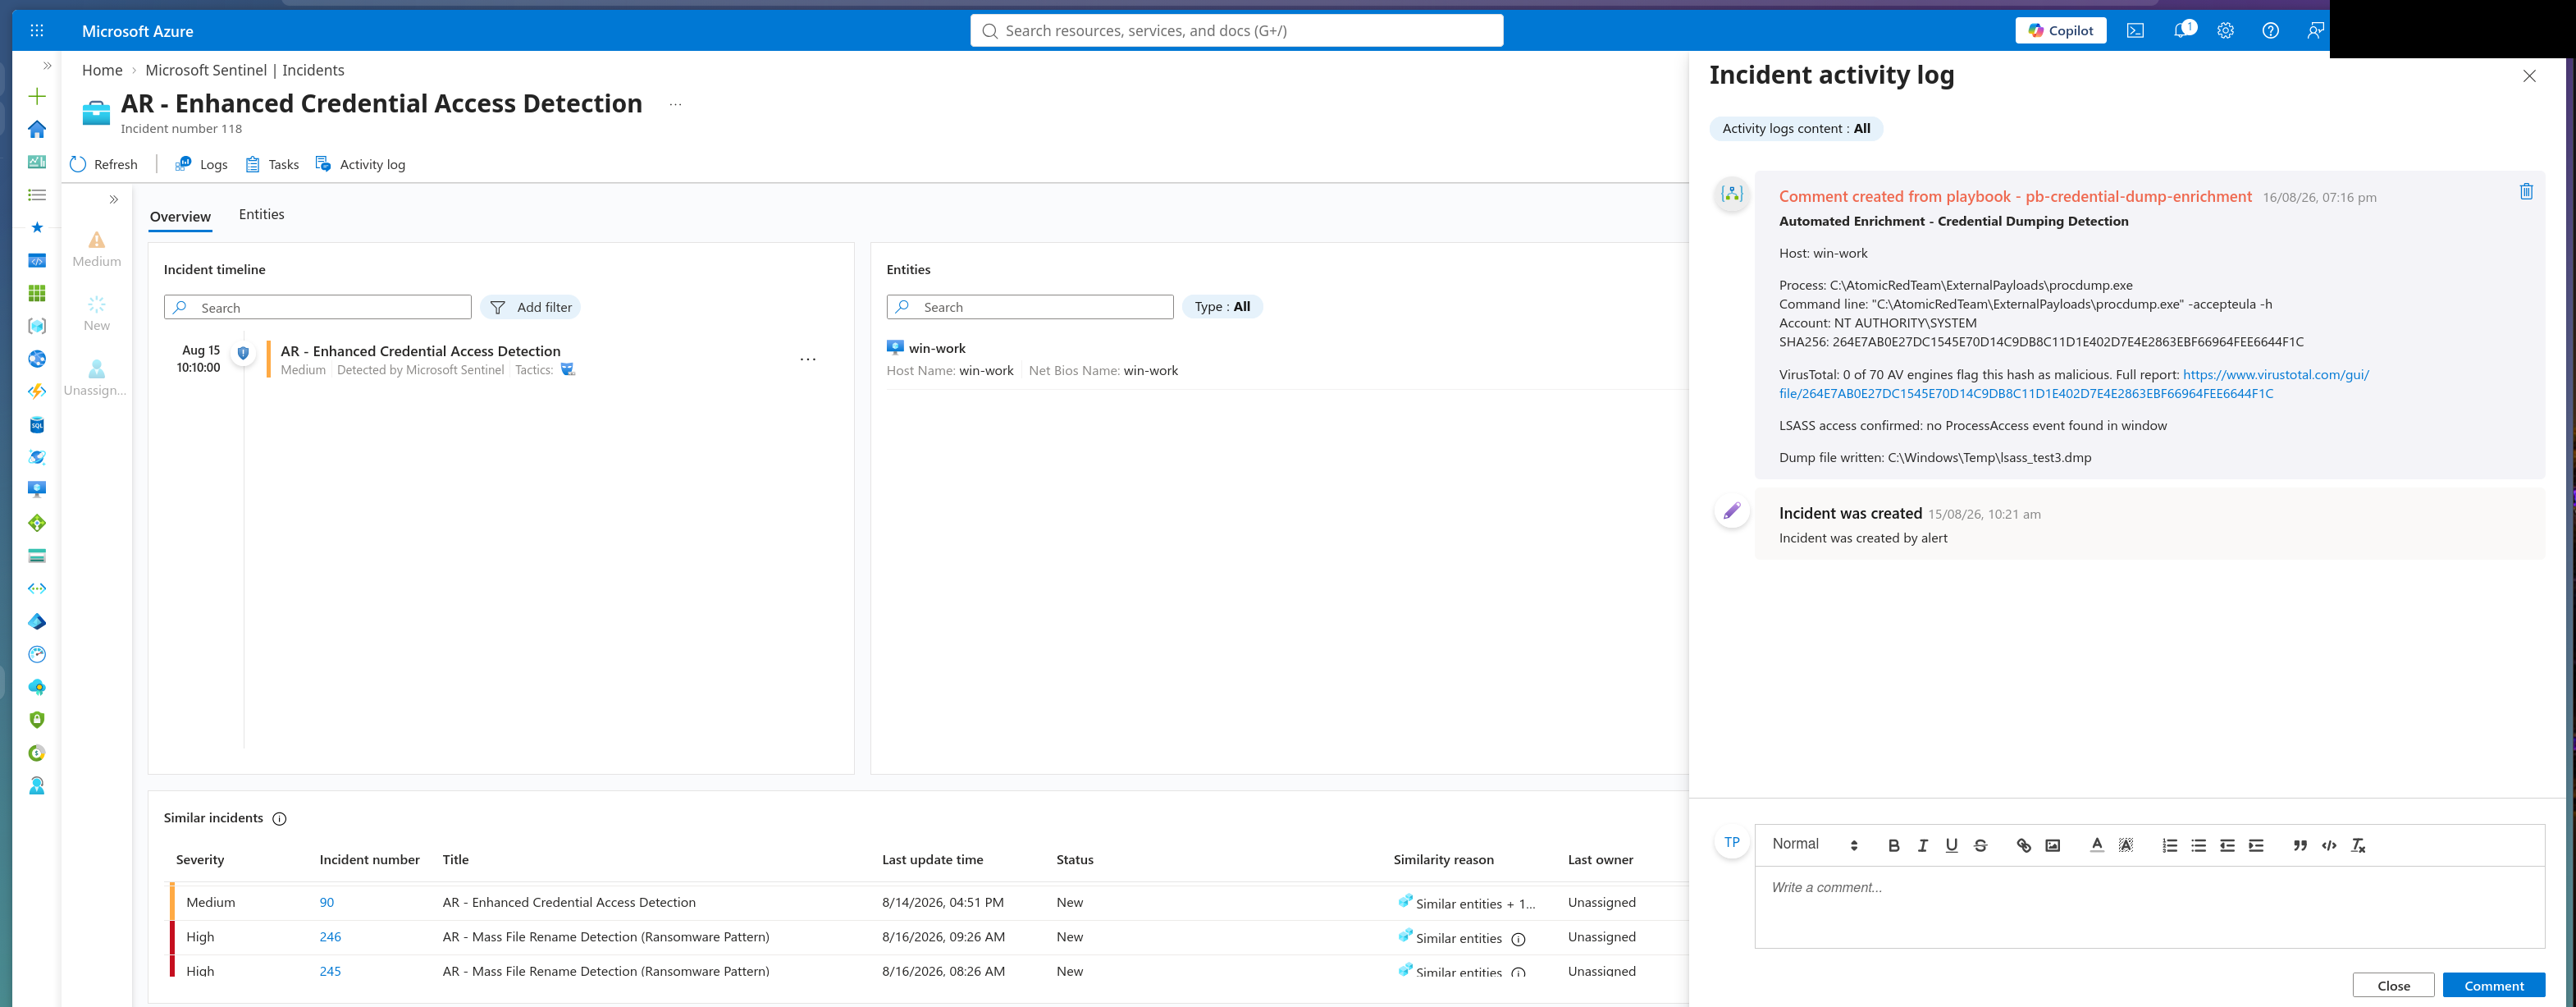 The same incident afterward: the full enrichment comment, host through dump-file evidence, sitting in the activity log with the playbook’s own name attached as the author.
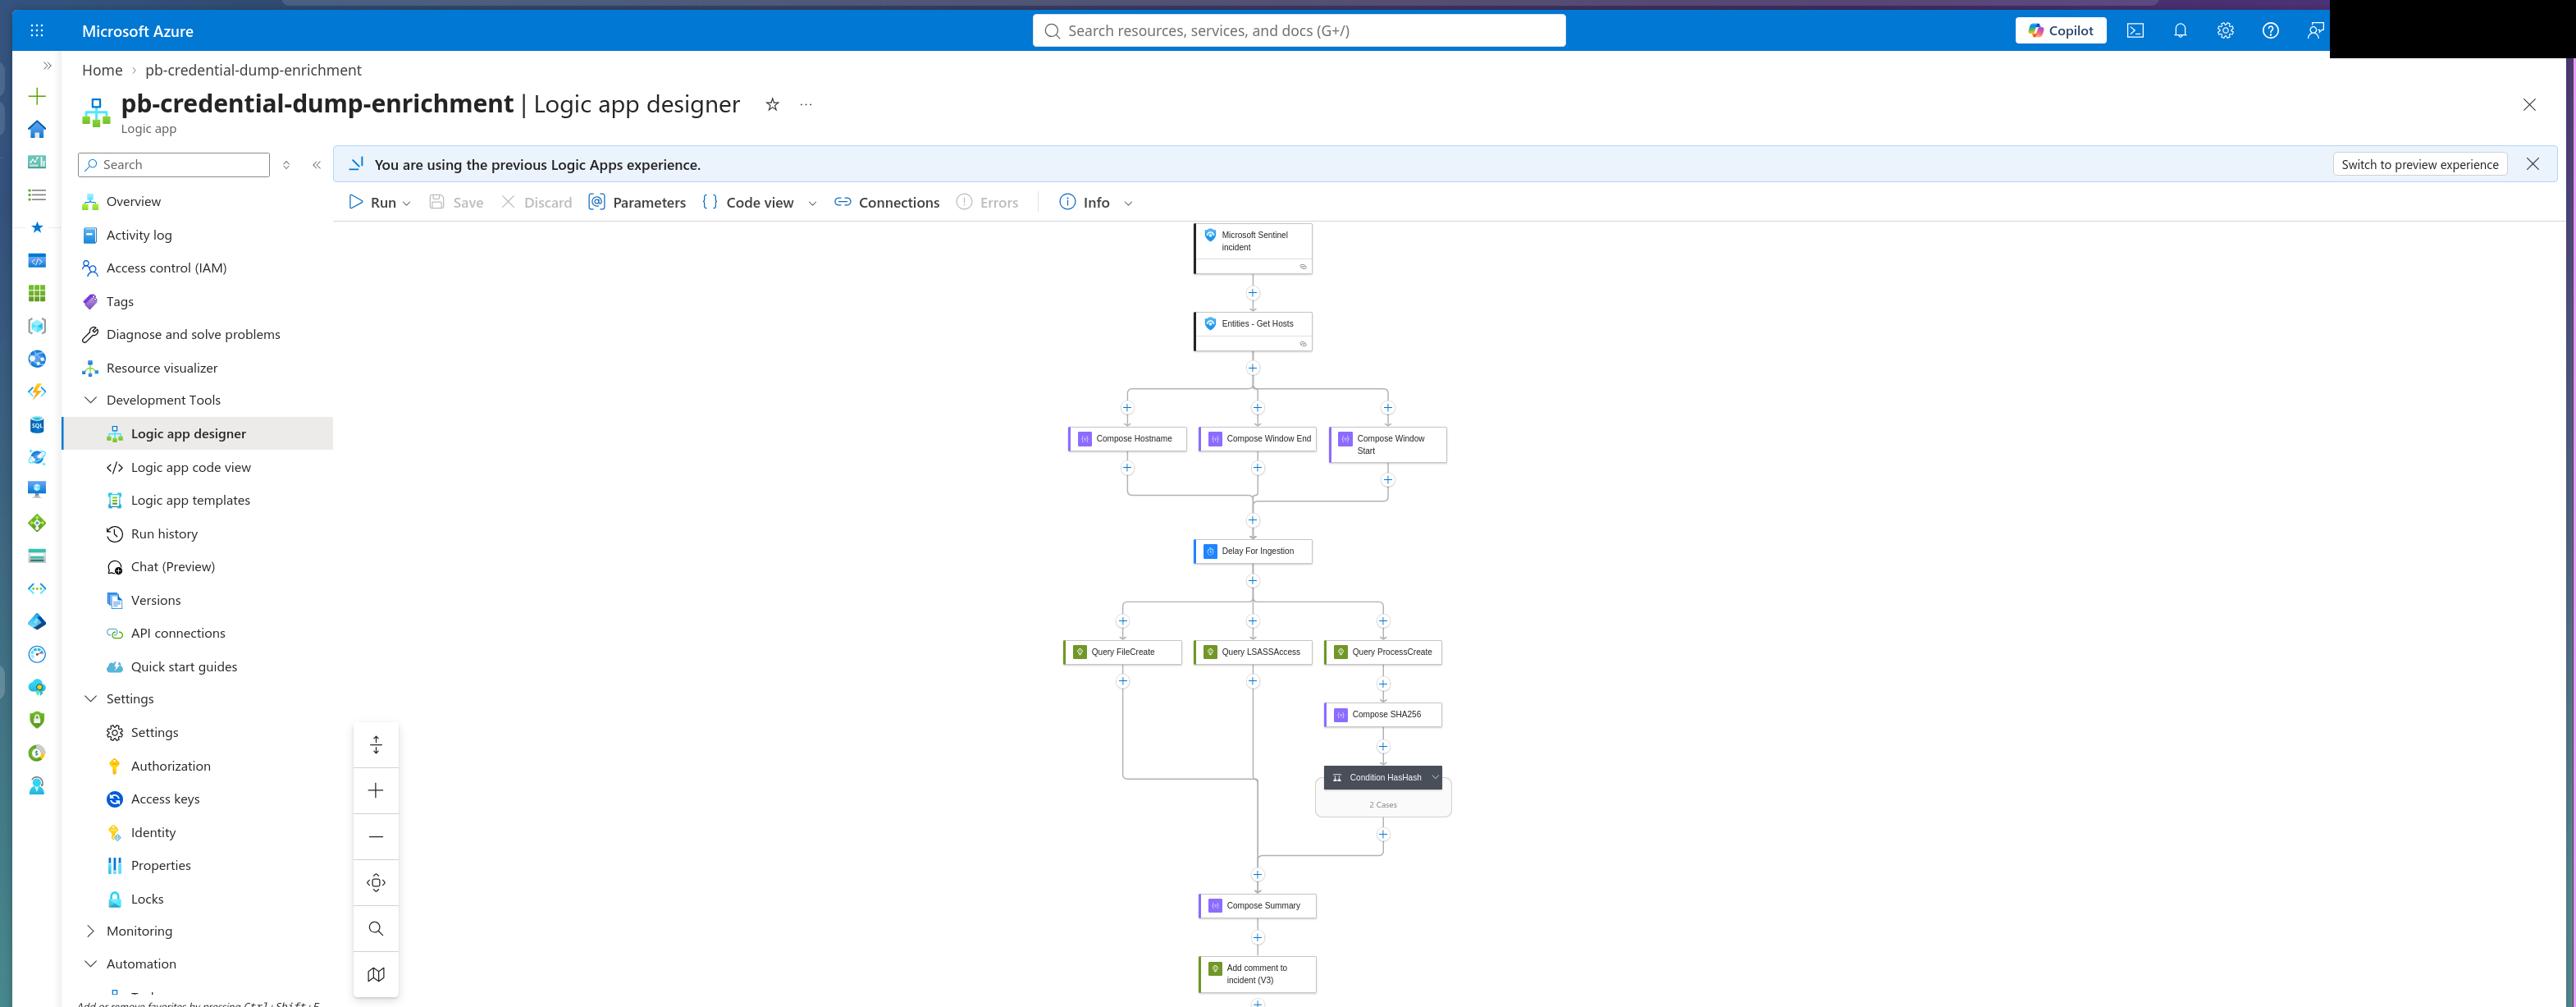 The full graph behind it — three parallel queries feeding a single hash, then a conditional branch.
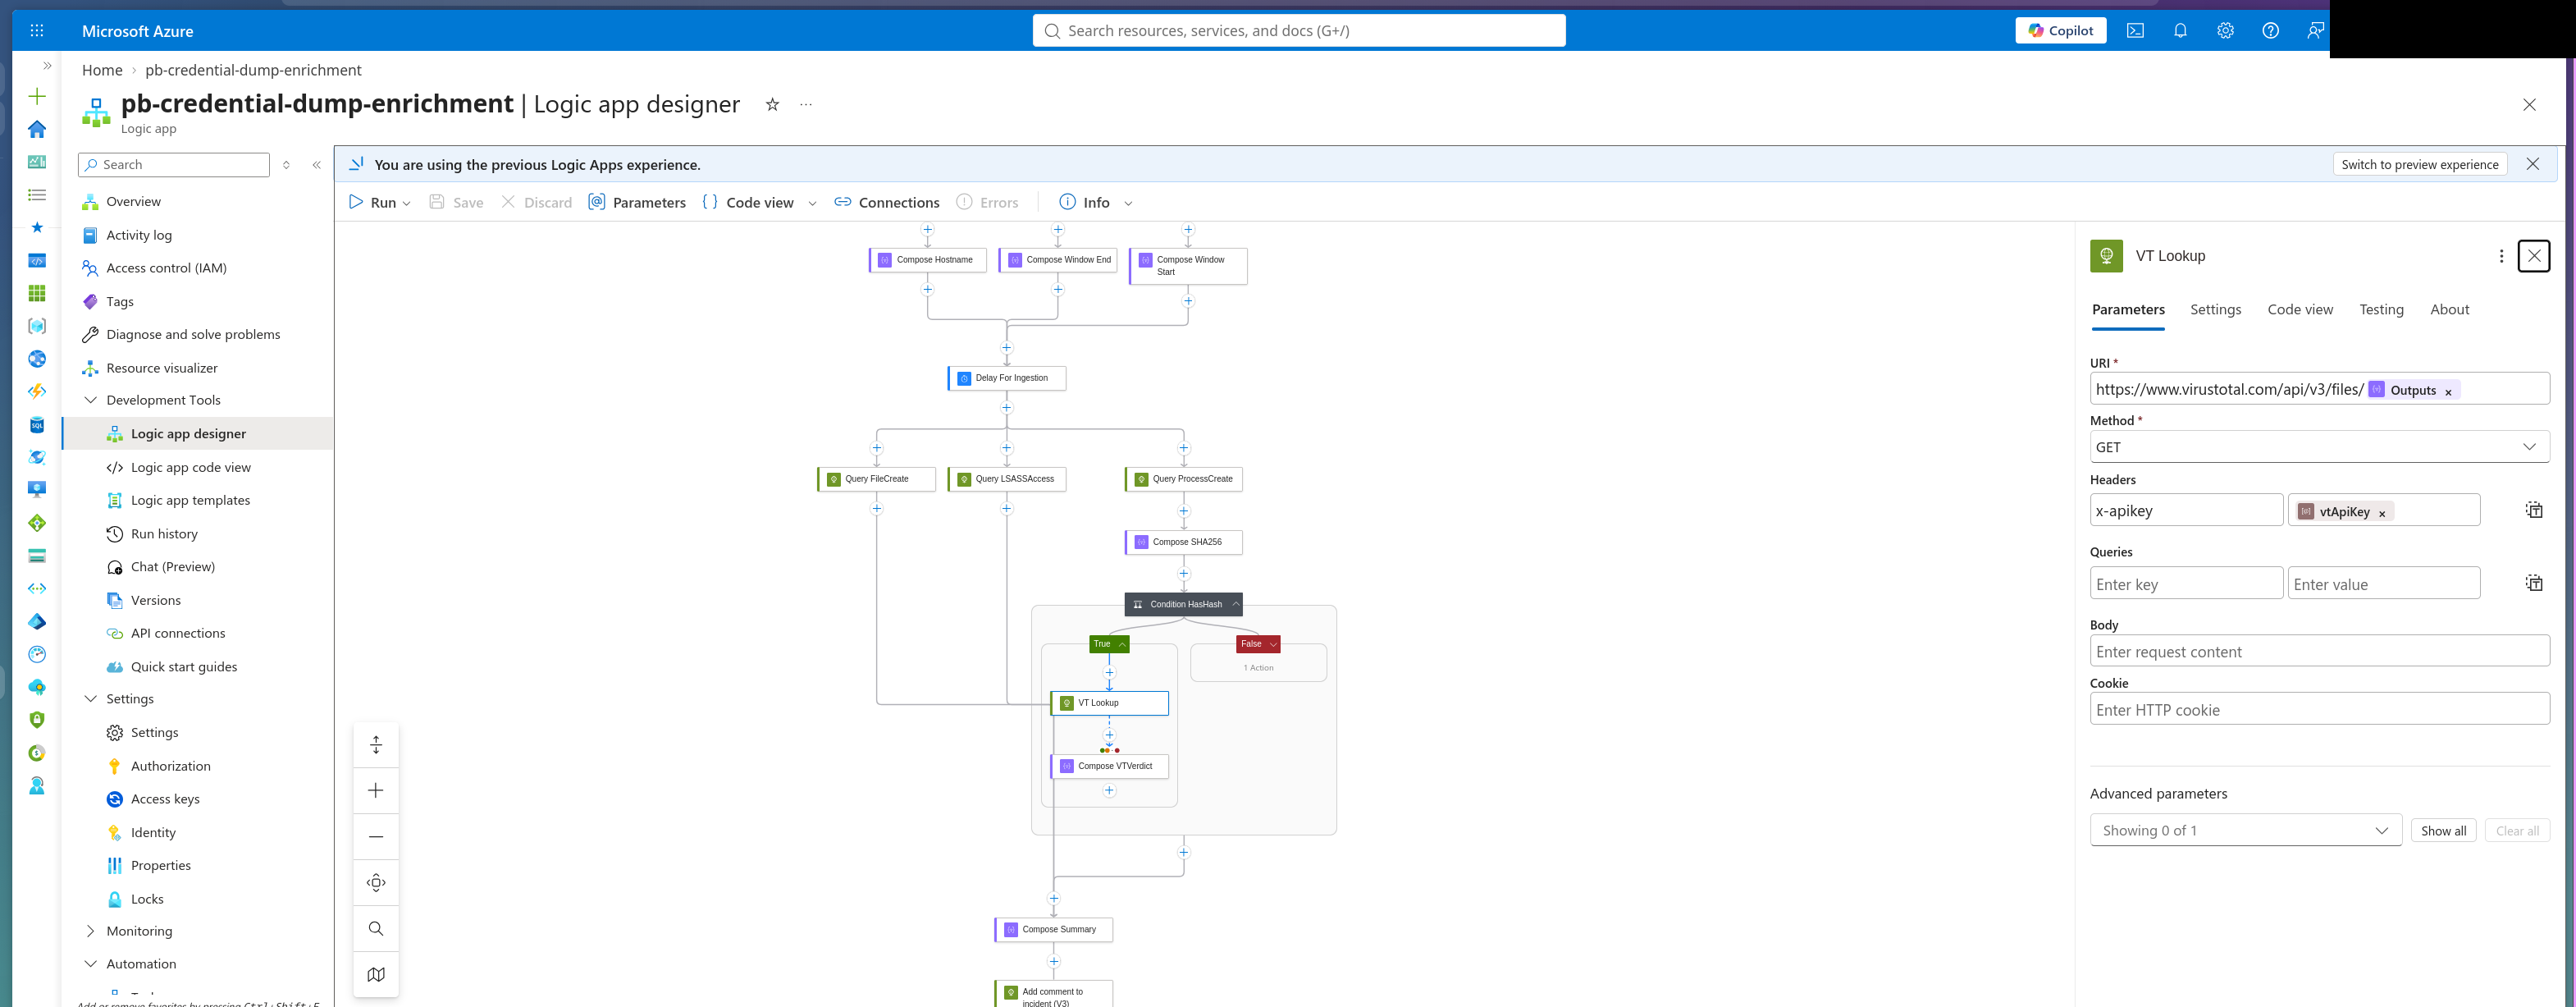 That branch expanded: the
 VT Lookup action itself, calling VirusTotal directly rather than stopping at a hash.
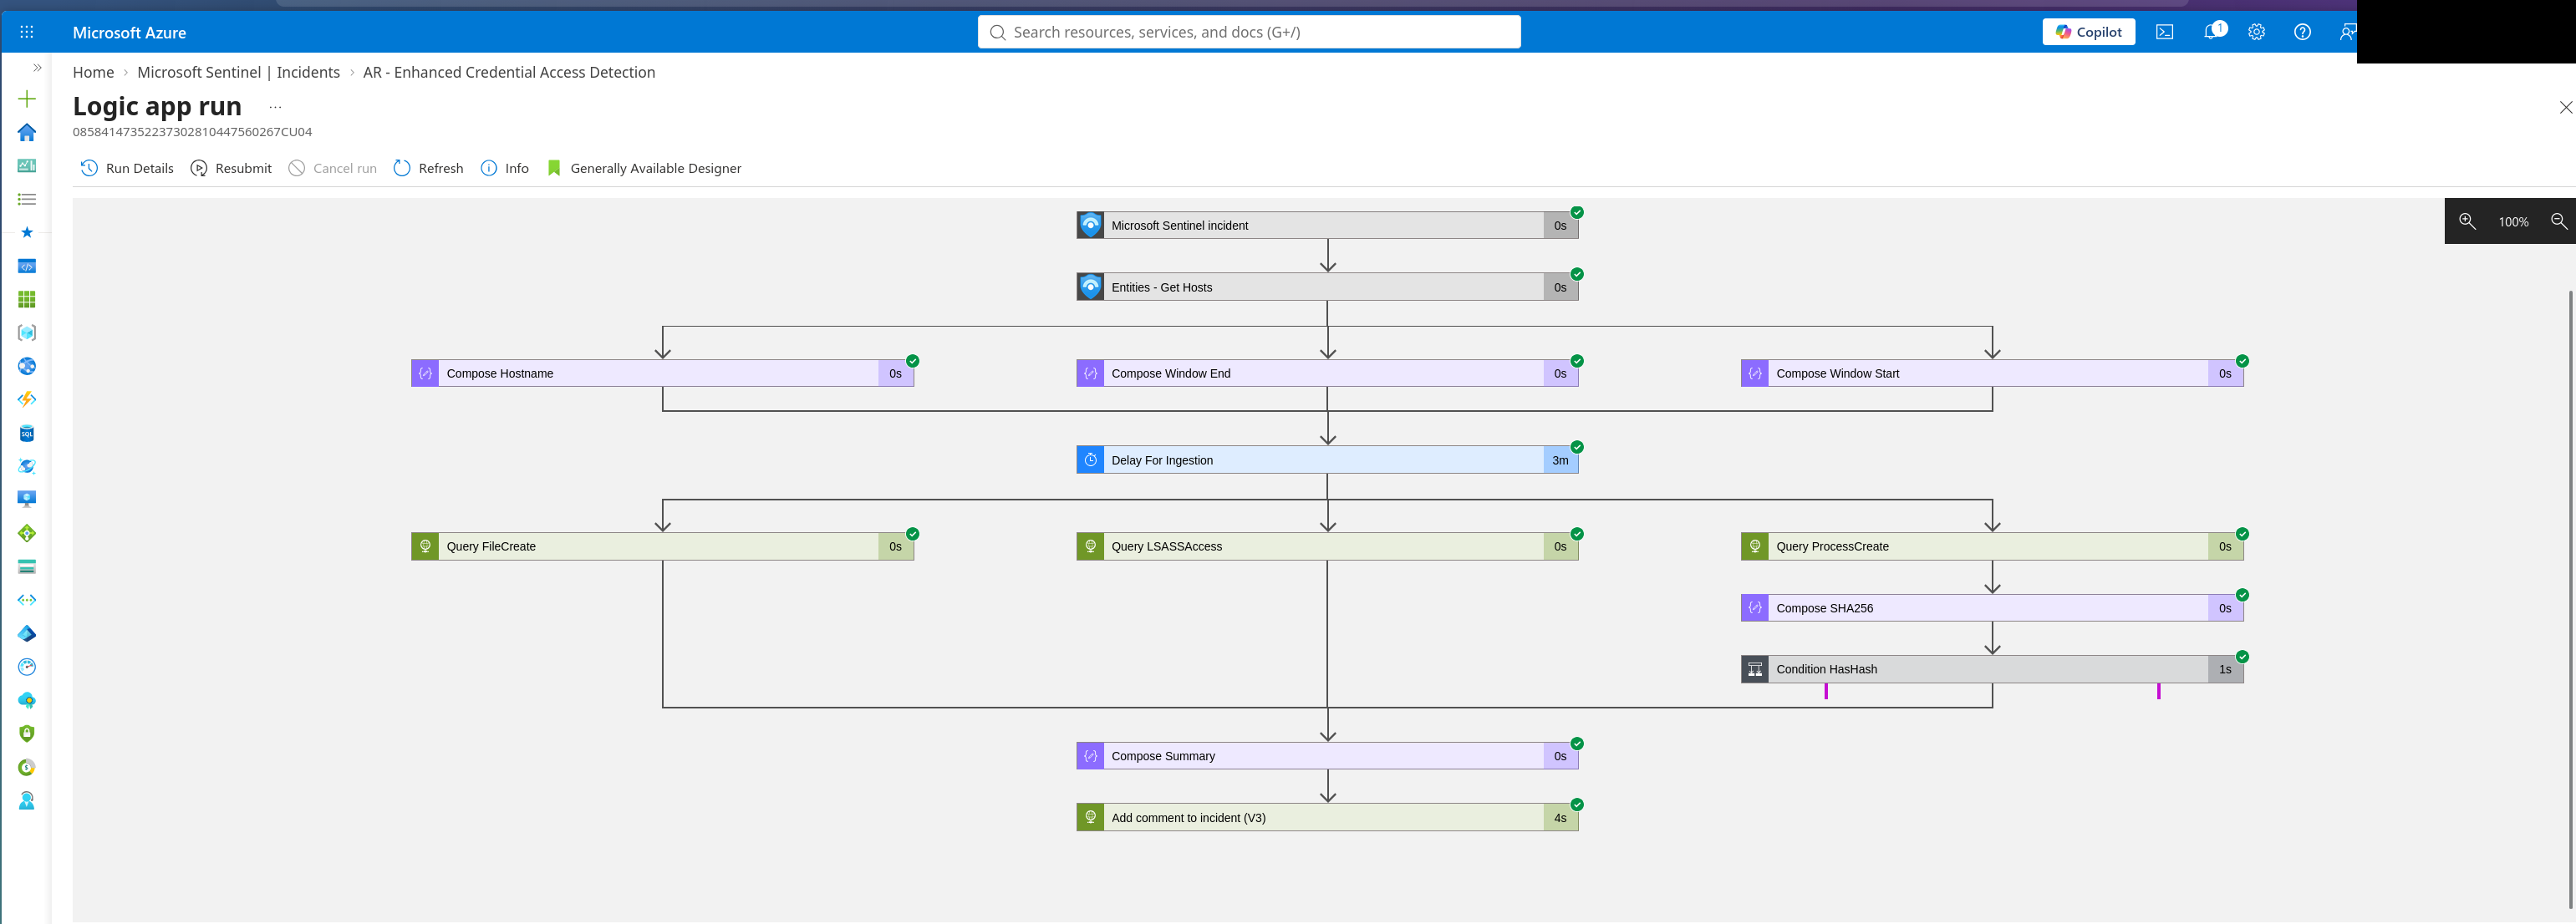 And a real run against this incident, action by action, including the deliberate
 Delay For Ingestion wait before any of the queries fire.
Two automations, two different SOAR patterns — one that escalates (Sentinel → ServiceNow, human does the deciding), one that enriches (playbook does research before a human ever looks).
Part 4 — Triggering It Yourself: Manual Attack from Kali
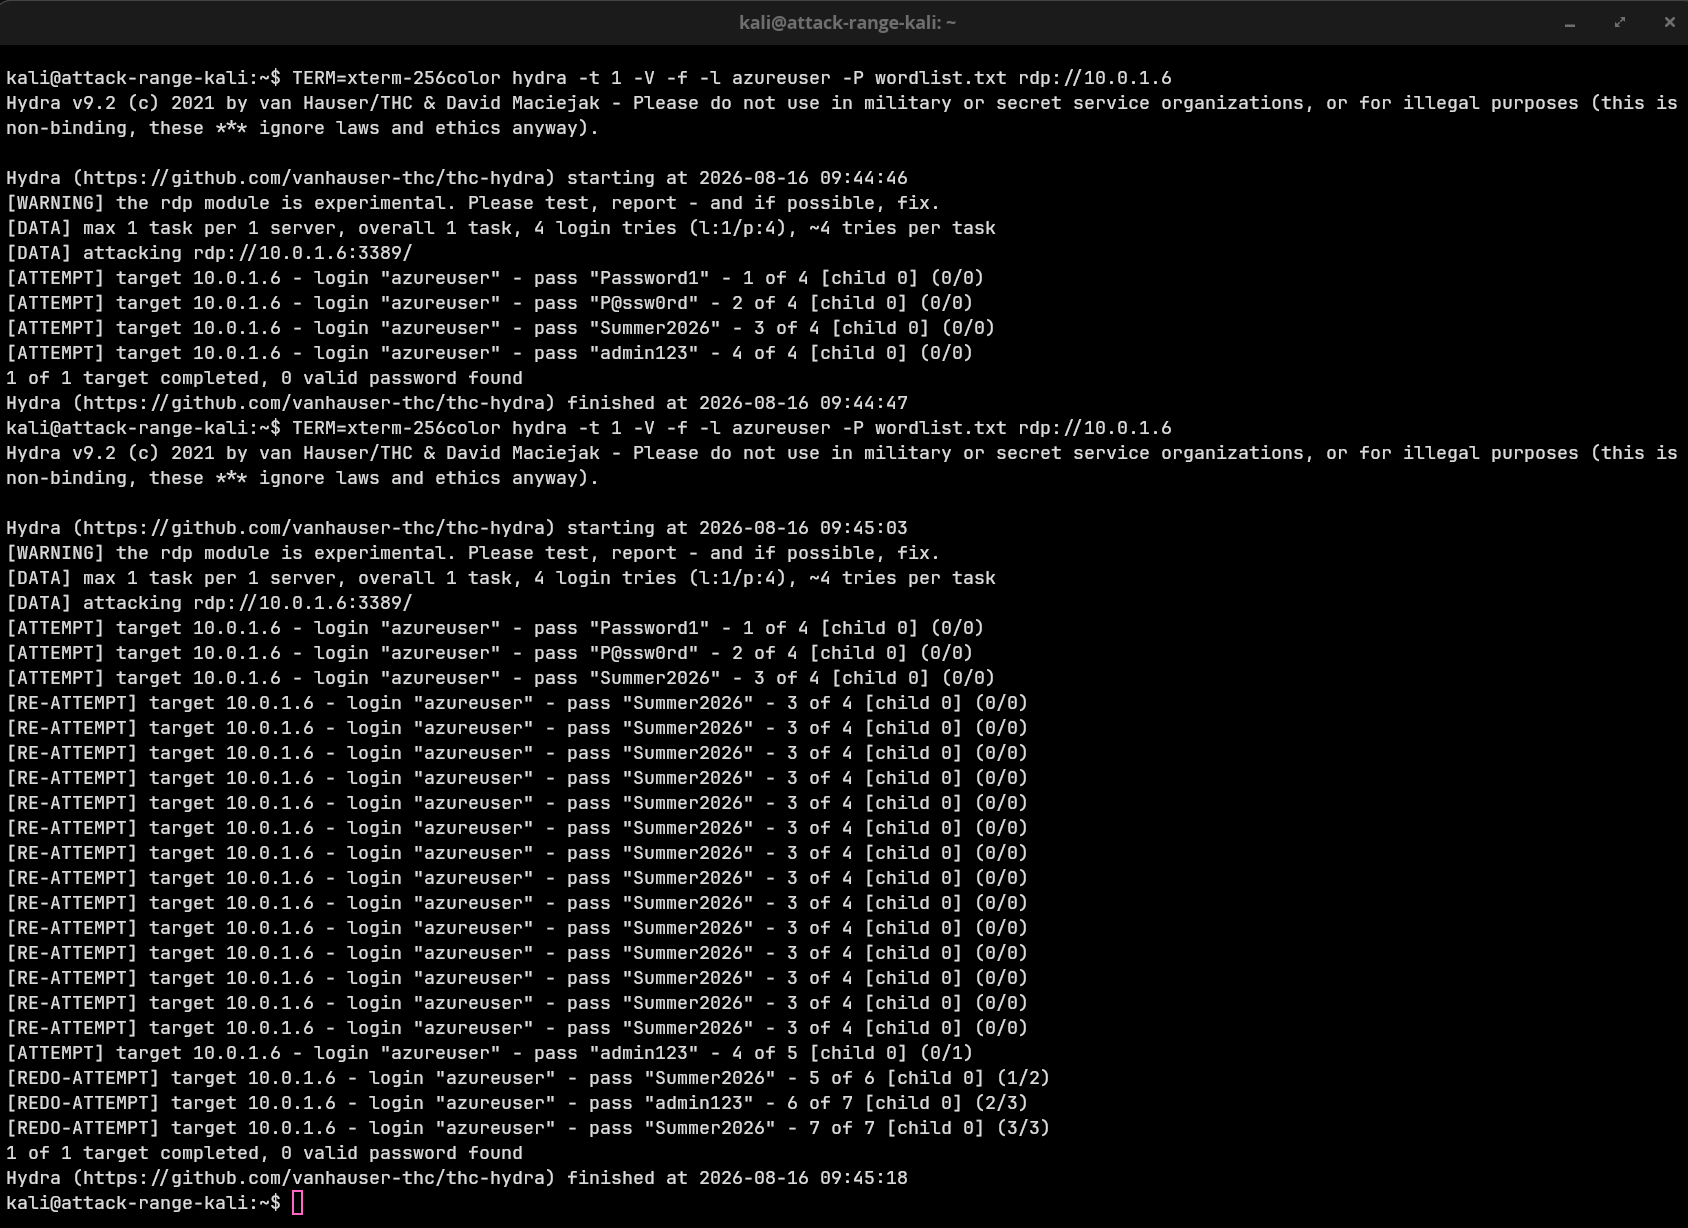
The plan was simple: SSH into the Kali attack box, run a brute-force RDP attempt against the Windows workstation, and capture the resulting Sentinel incident landing with a timestamp close enough to the terminal output to make the cause-and-effect obvious. What actually happened proved something more interesting than the plan.
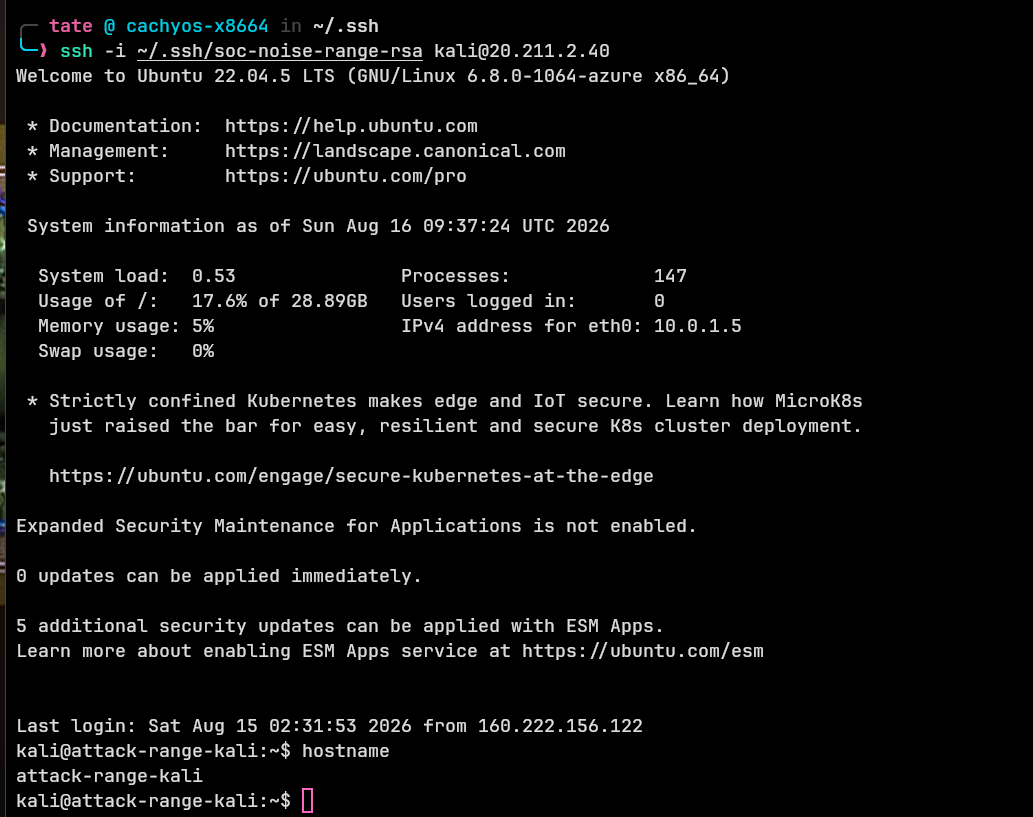
First attempt: NSG blocked it
Pointing hydra at the workstation’s public IP failed outright — every attempt returned [ERROR] freerdp: The connection failed to establish, which looked like an RDP/NLA compatibility issue with hydra’s (admittedly experimental) RDP module. It wasn’t. The range’s NSG only allows inbound RDP from one allowlisted admin IP; traffic from Kali to the workstation’s public IP was being dropped before it ever reached the RDP listener. Since Kali and the workstation share a VNet, retargeting hydra at the workstation’s private IP instead bypassed the public-IP-scoped rule via Azure’s default intra-VNet allow, and the attempts actually reached the RDP service.
Second finding: the “brute force” rule wasn’t watching the target
An incident landed almost immediately — but it fired from syslog on the Kali box itself, triggered by the sudo apt install hydra command line, via a rule literally named for catching the environment’s own Ansible attack-simulation playbook. It’s a legitimate detection (attacker tooling installed as root, on the attacking host), but it isn’t a brute-force detection — it fires on tool installation, not on the RDP attempts themselves, and it would never catch an attacker who already had their tools staged.
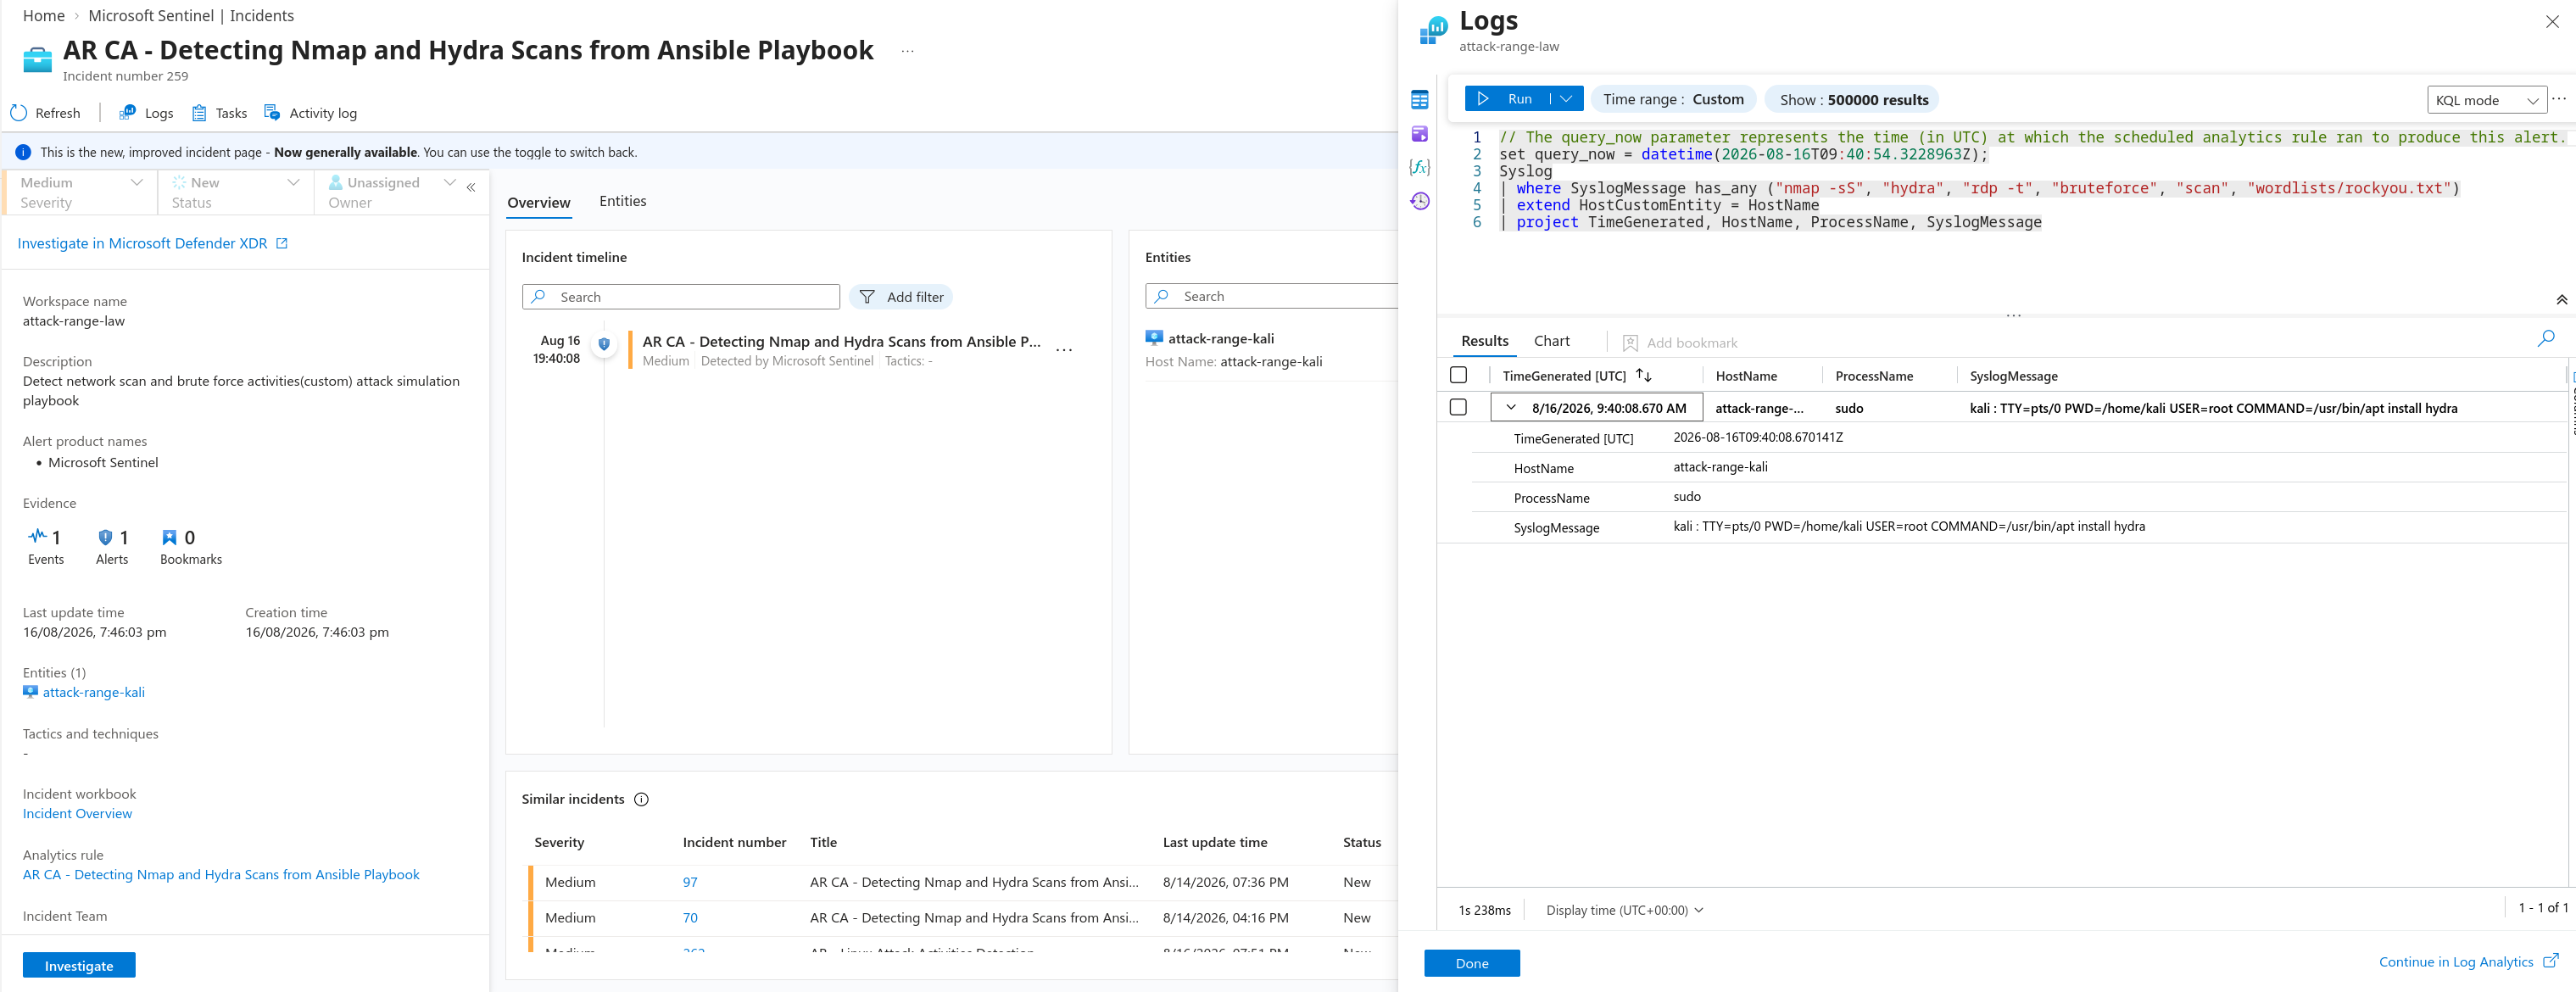 The incident and the exact syslog line it fired on —
 apt install hydra, run through sudo.
A second rule, “AR - Linux Attack Activities Detection,” is tagged T1110 Brute Force but is built the same way — host-side syslog keyword matching on the Kali box, not failed-logon telemetry from the target.
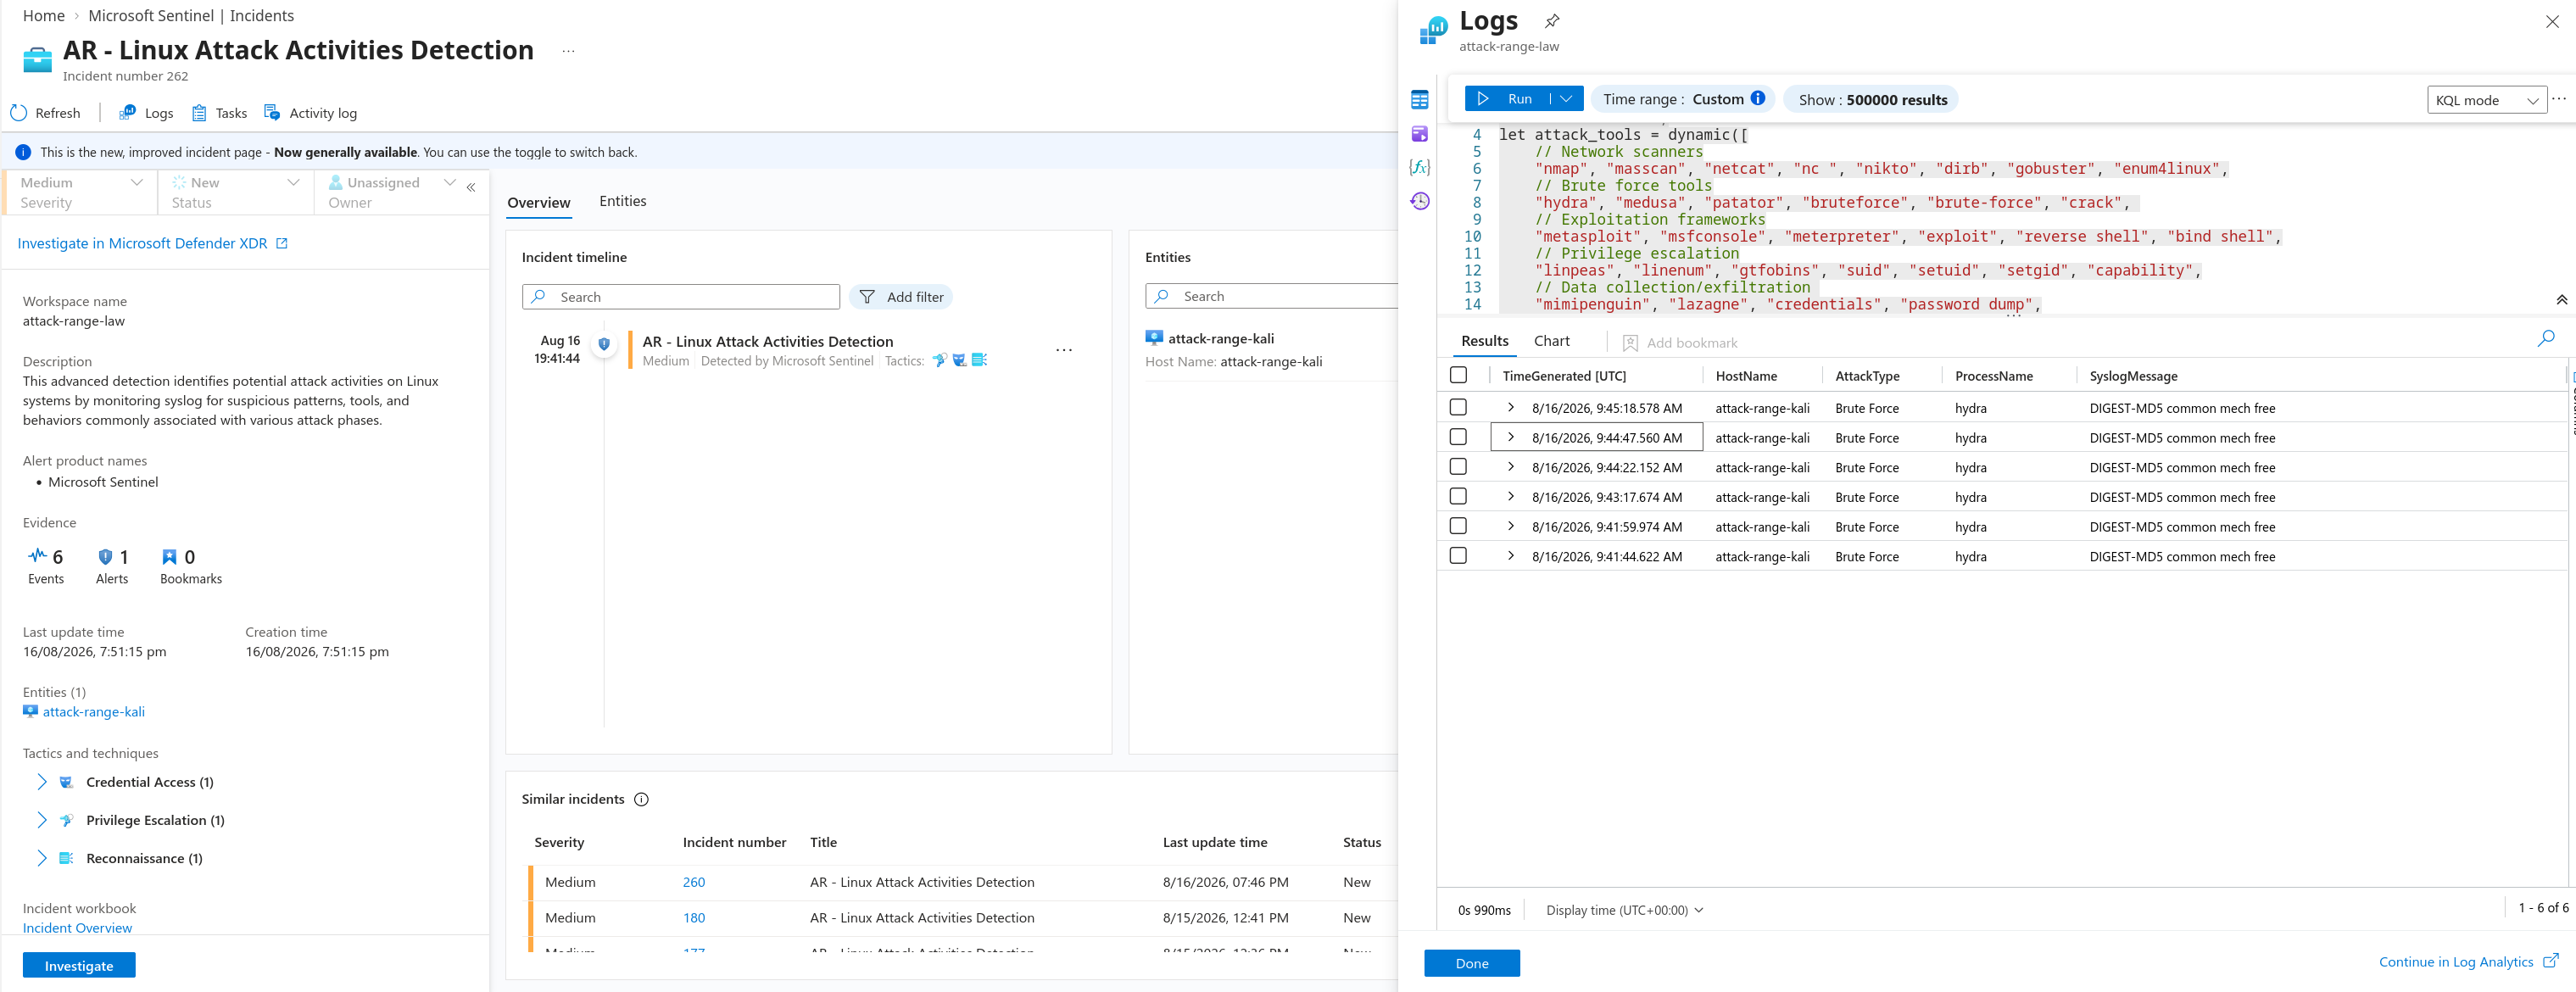
The instinct at that point was to conclude the environment had a real gap — attack-host visibility without target-side authentication telemetry — and start drafting a replacement rule to close it: a scheduled query against SecurityEvent for repeated EventID 4625 (failed logon) from a single source IP against win-work, entity-mapped and MITRE-tagged T1110. That draft got as far as the KQL before being shelved.
The actual lesson: it wasn’t missing, it was just slow
Before deploying a redundant rule, the existing analytics rules got a second look — and a real one was already there: AR - Brute Force Authentication Detection, watching SecurityEvent for EventID 4625 with a 5-minute detection window, a threshold of 5 failed attempts, a known_ips/known_exemptions allowlist for service accounts, and failure-reason extraction from the raw SubStatus code — a properly engineered rule, not a stub. It just hadn’t populated yet at the moment the syslog incident was first checked, because scheduled analytics rules run on their own interval and Log Analytics ingestion lags real time by several minutes. Checking again after that latency window had actually passed, both hydra runs were sitting there correctly attributed: 8 failed attempts at 09:40 and 12 at 09:45, both against win-work, both from 10.0.1.5 — Kali’s private IP as the source of the failed logons (the IpAddress field on a 4625 event is the origin, not the target; Computer is the target).
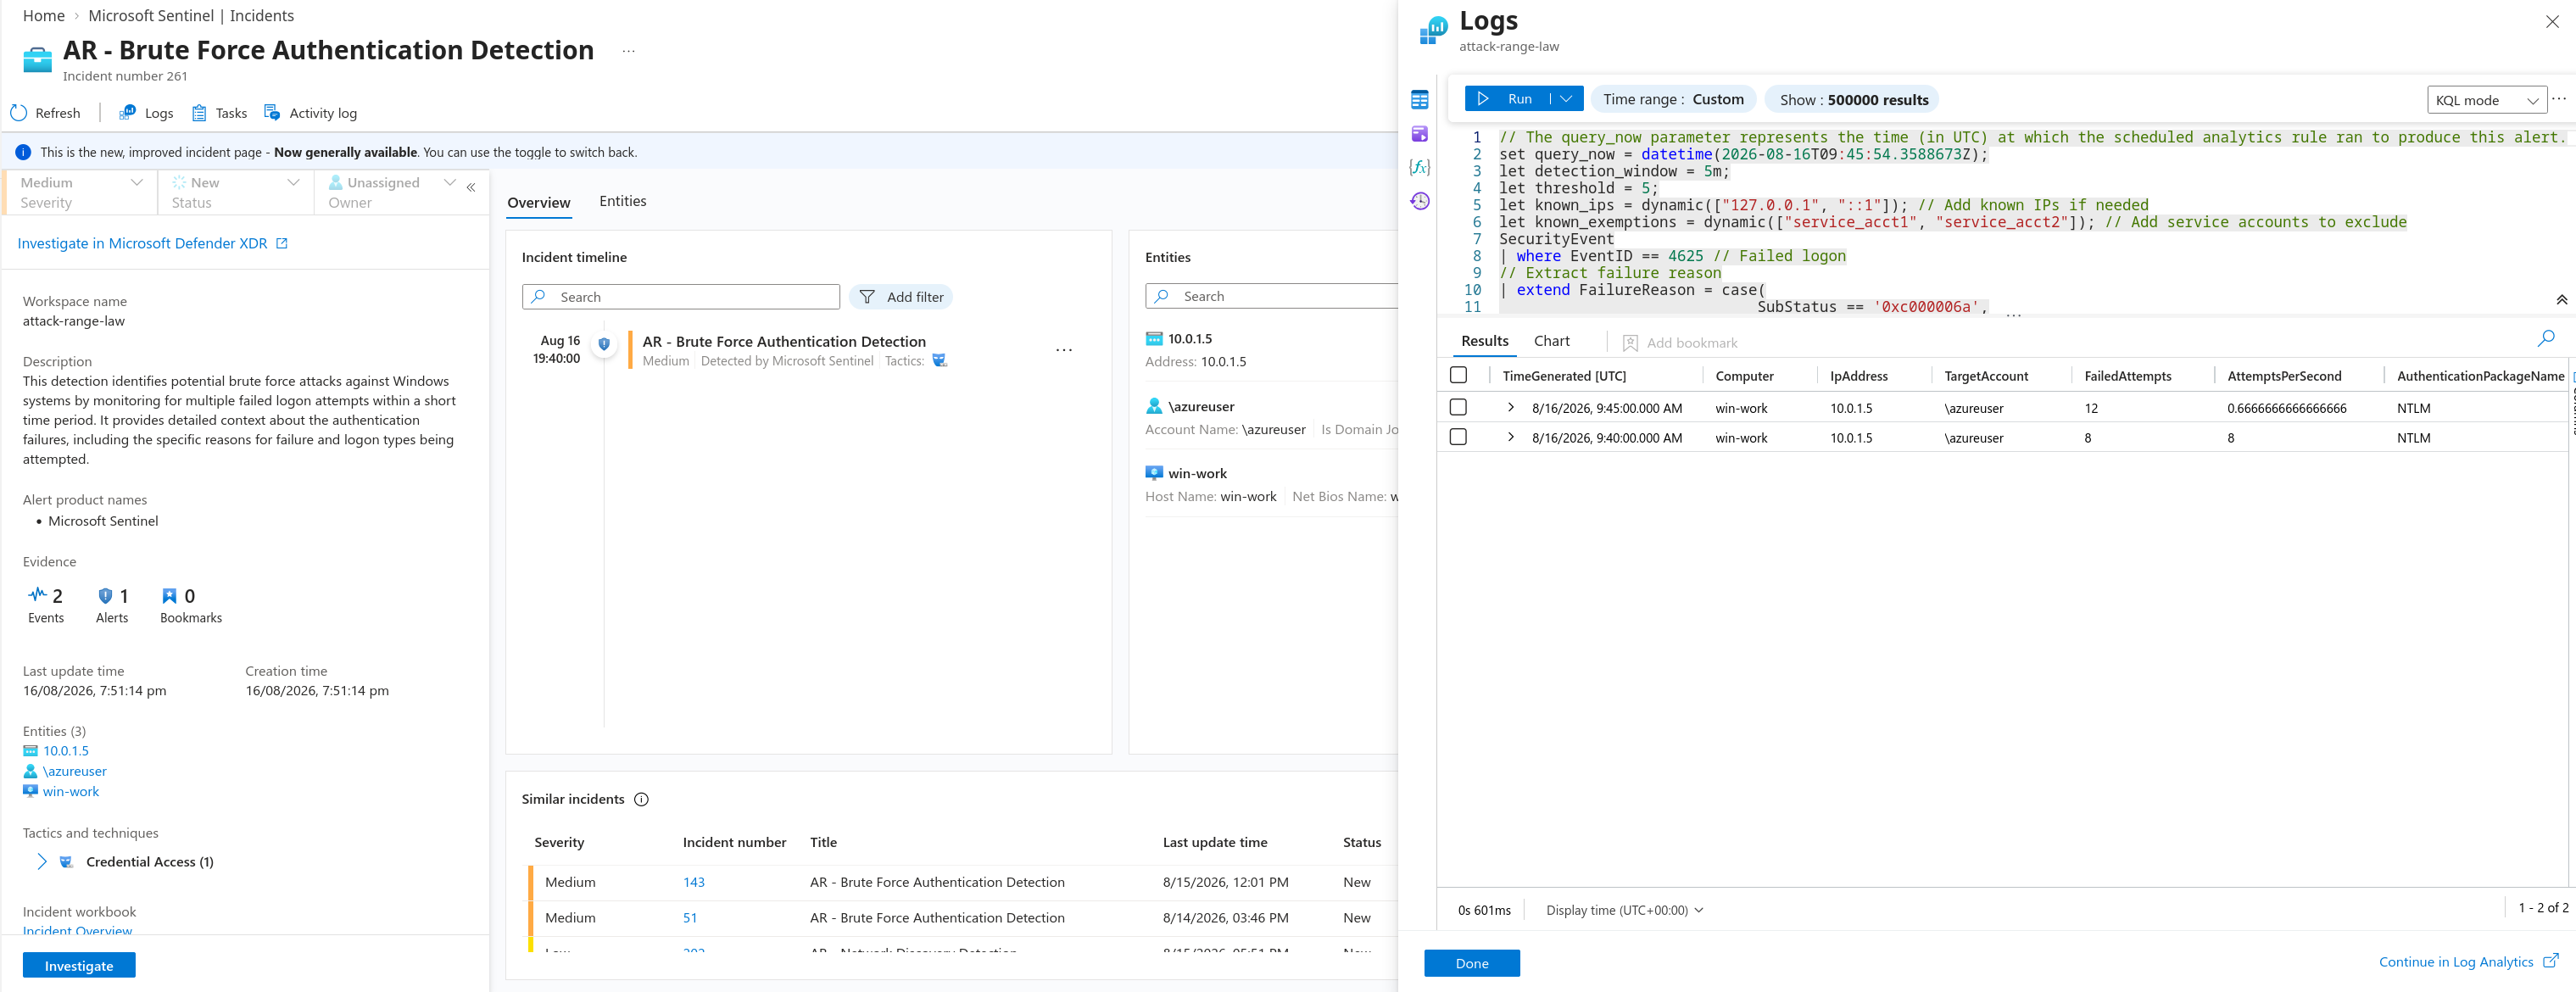
This section isn’t really about hydra — it’s about the difference between “I don’t see a detection for this” and “there is no detection for this,” and how easy it is to conflate the two under ingestion lag. The correct move wasn’t building a new rule on a hunch, it was checking again once the expected latency window had actually elapsed.
Part 5 — Deep Dive: Solorigate Network Beacon
A third worked incident, in the same training workspace as Part 2 — this time starting from a DNS indicator rather than a sign-in pattern, and closing with a handover instead of a resolution.
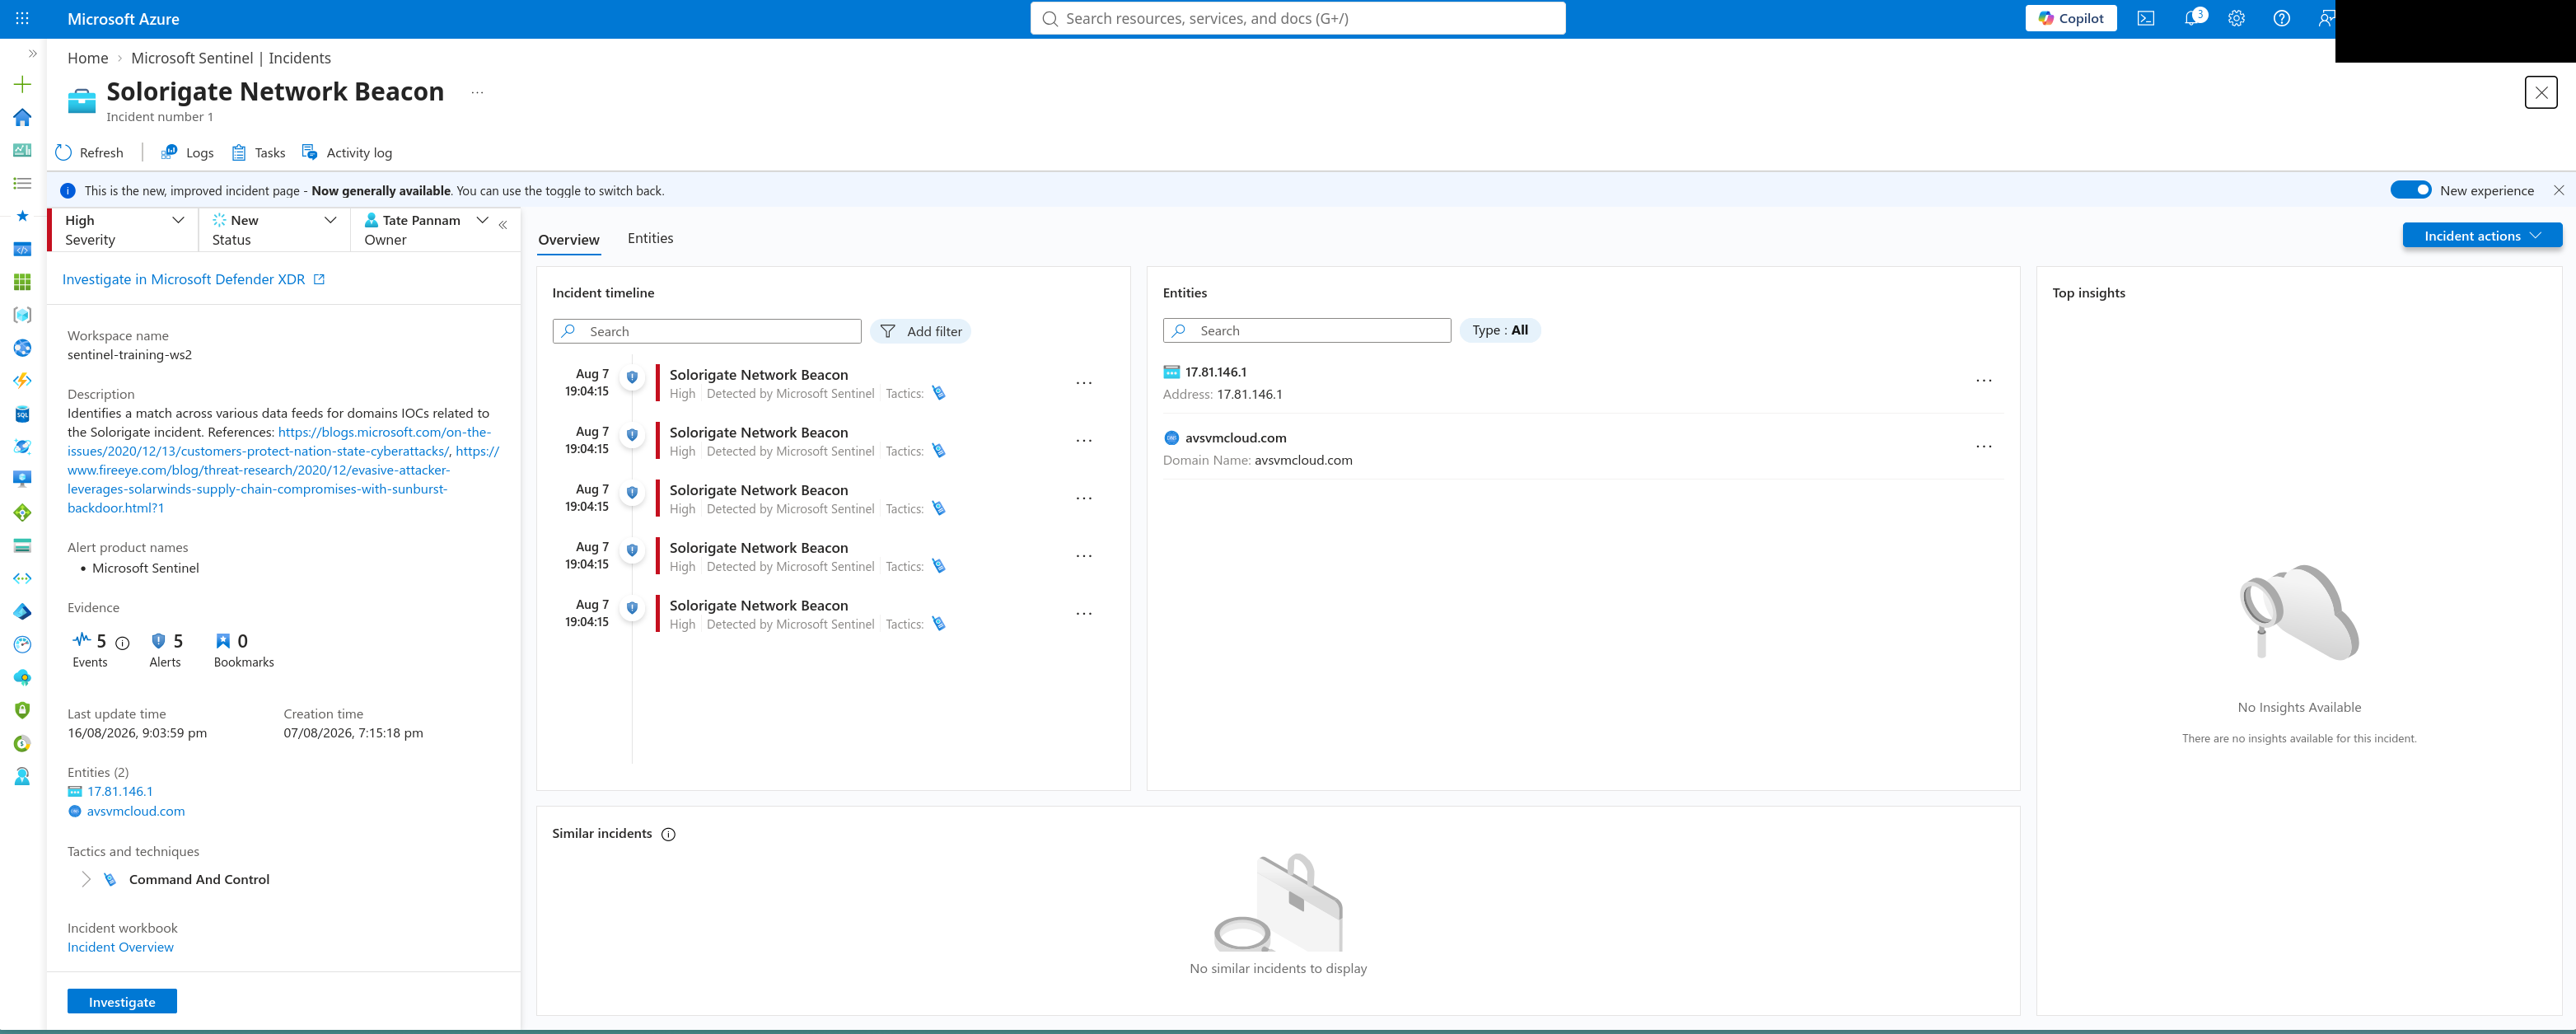 The incident as it starts: one host, one detection, no indication yet of how far it actually spread.
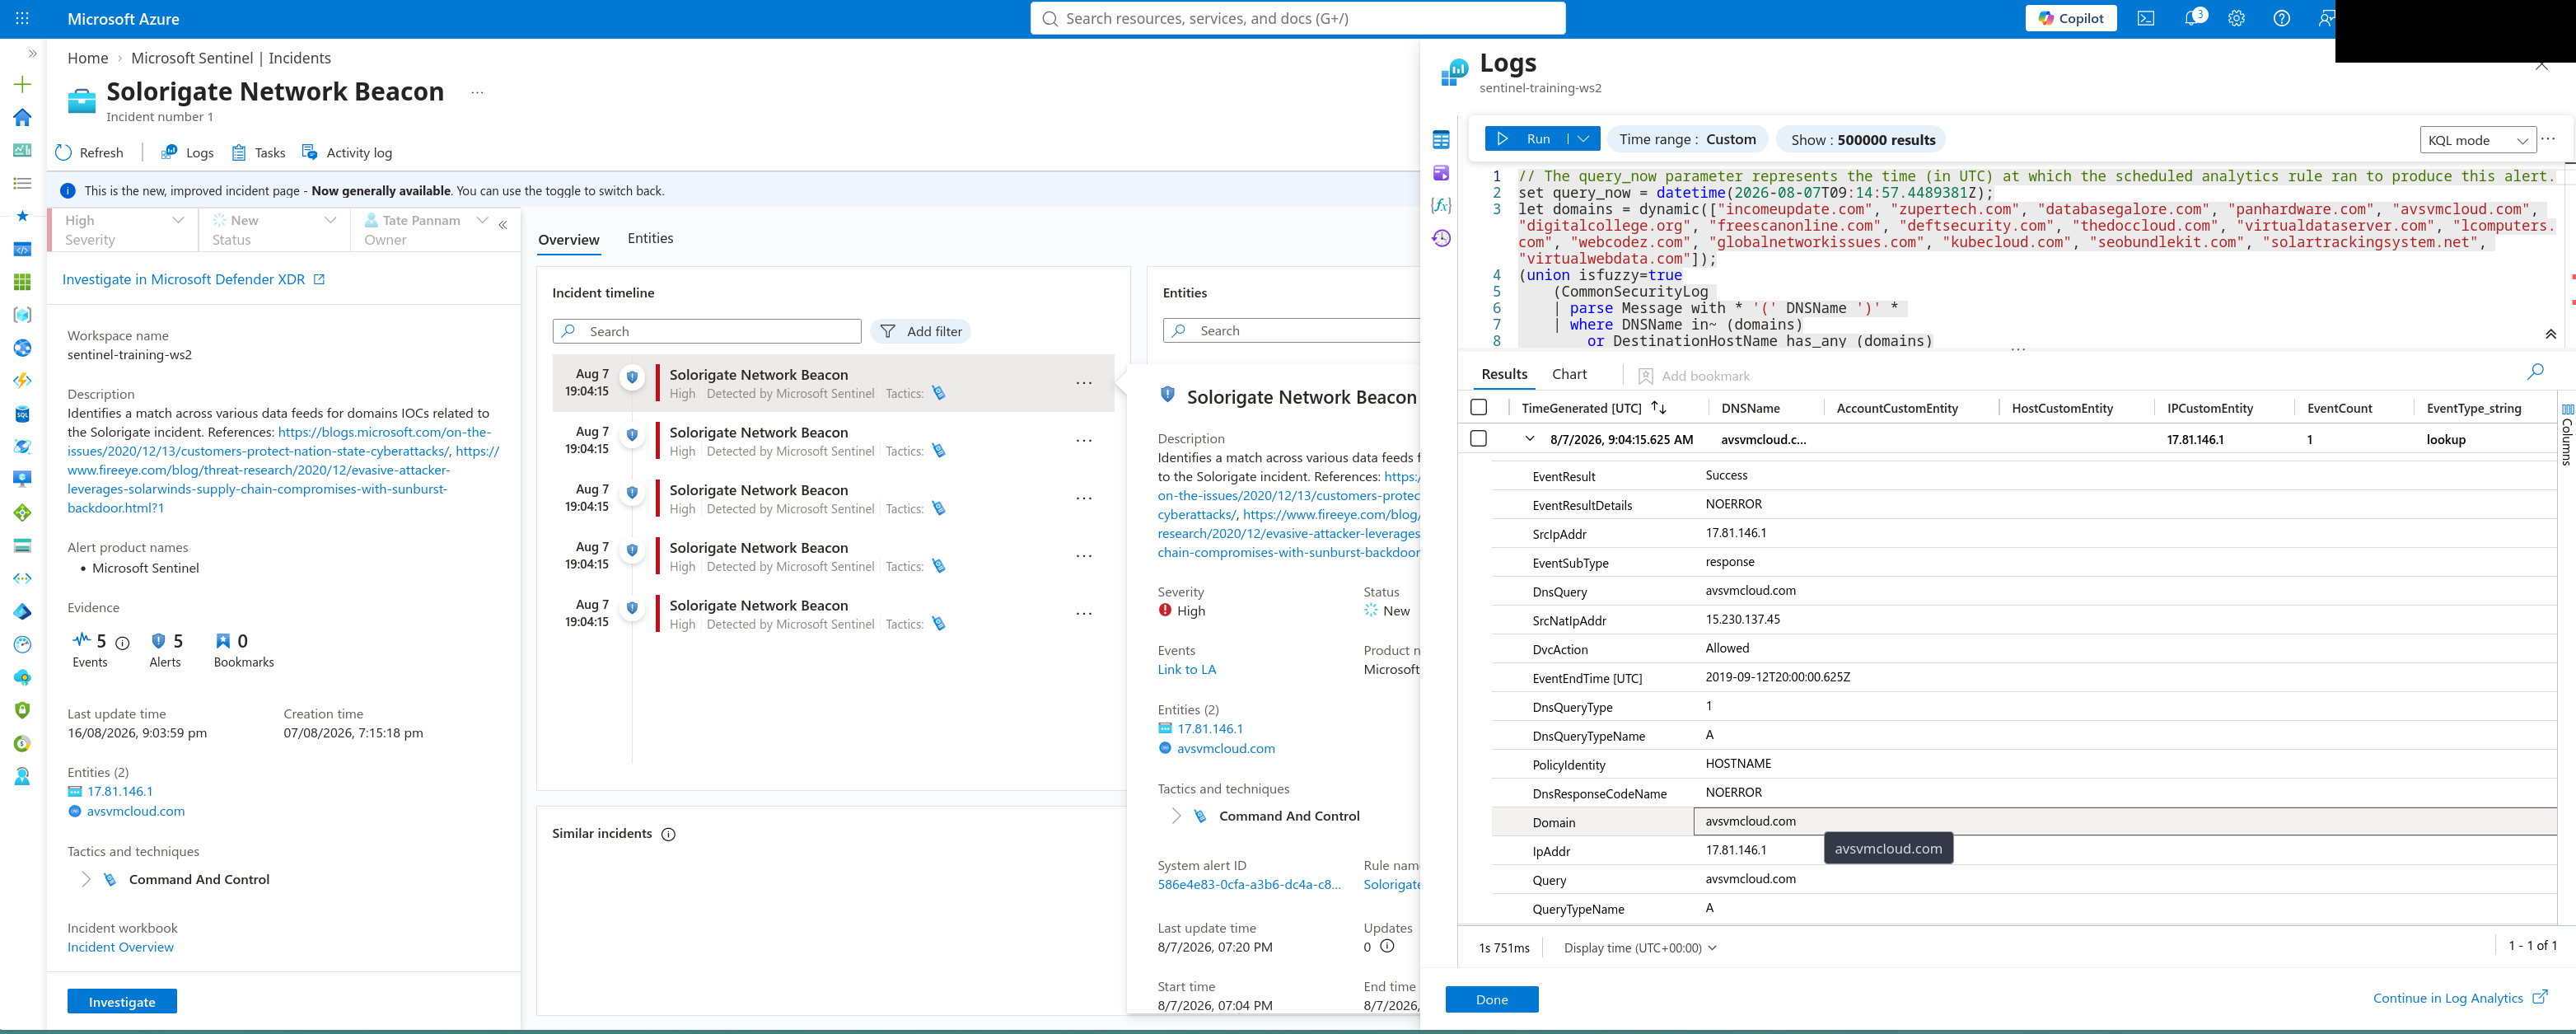 The DNS IOC behind it —
 avsvmcloud.com, resolved through events normalized via ASIM rather than a single vendor’s raw DNS schema, so the same detection logic holds regardless of which product actually logged the query.
The single flagged host wasn’t the full picture. Running a SolarWinds inventory-check hunting query — sourced from Microsoft’s own public incident-response guidance for this exact campaign, not written from scratch — against the environment turned up two more hosts carrying the same malicious DLL and named pipe.
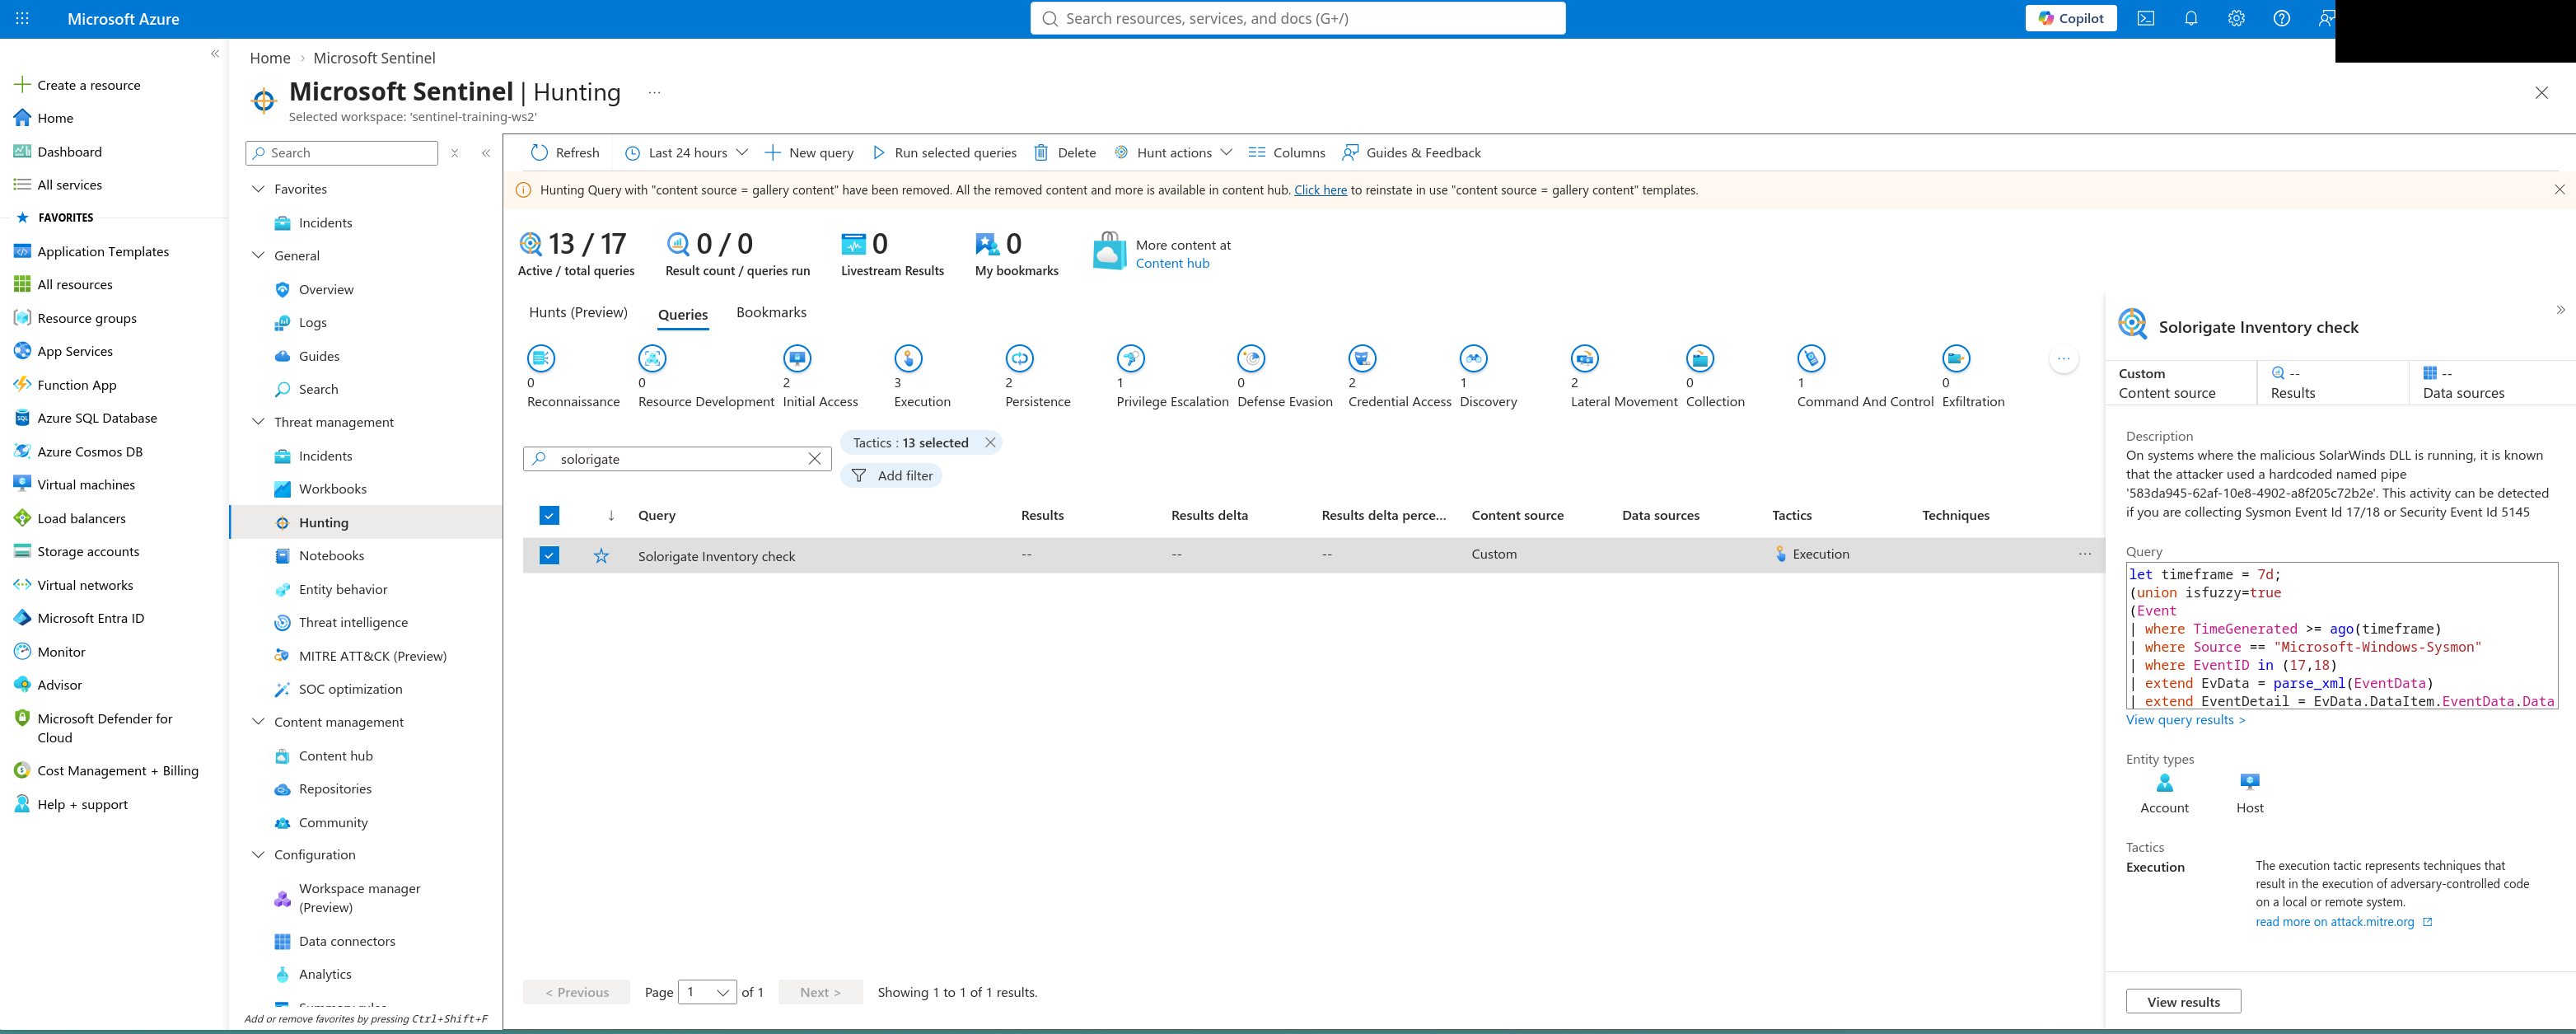 The hunting query itself, filtered to the Solorigate inventory check.
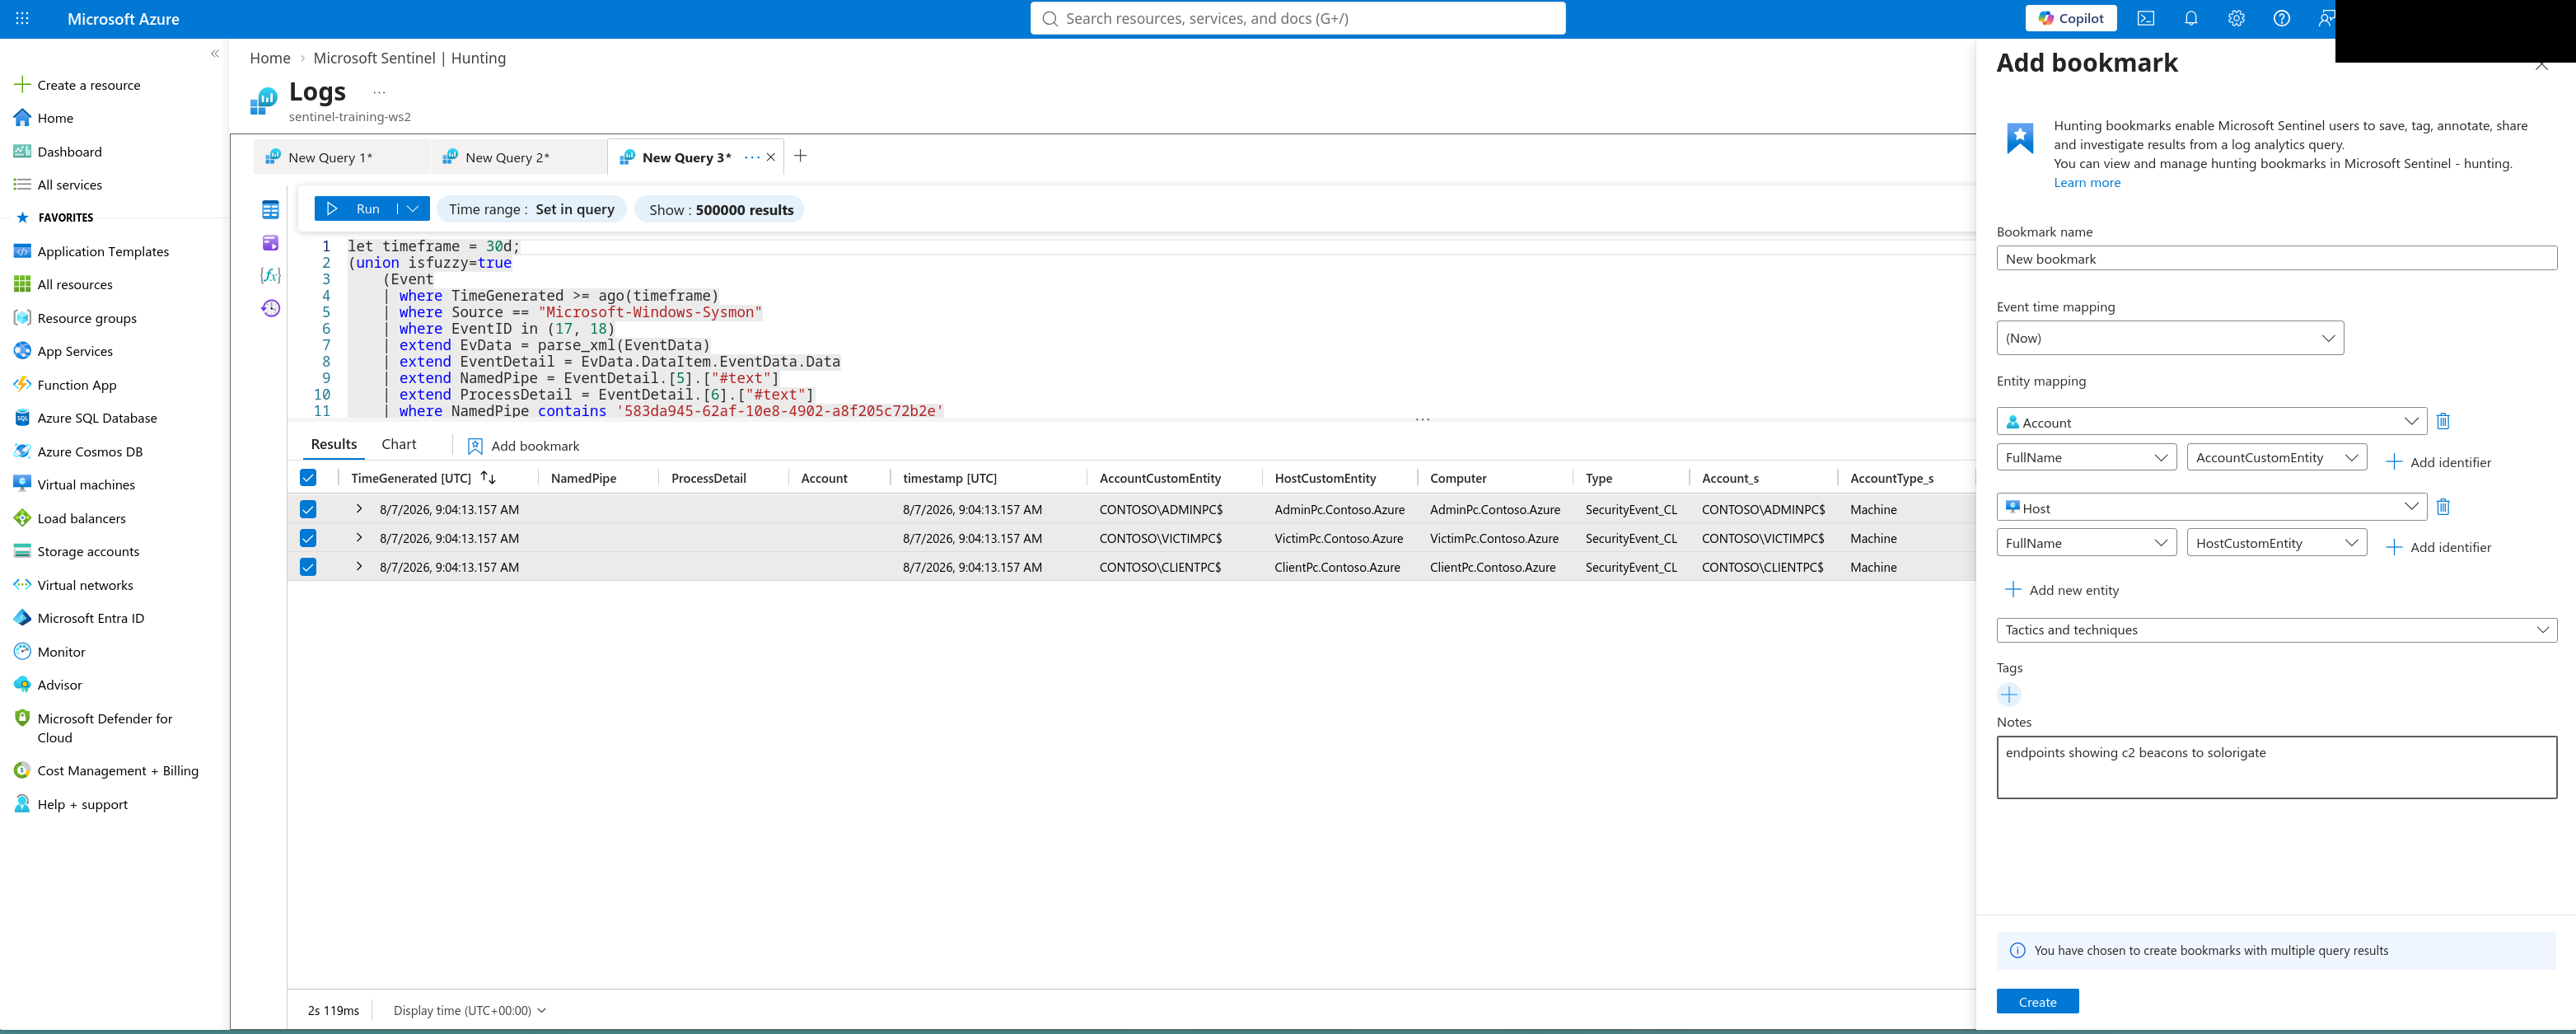 Three endpoints communicating with the same C2 infrastructure — one already known, two the original alert never surfaced.
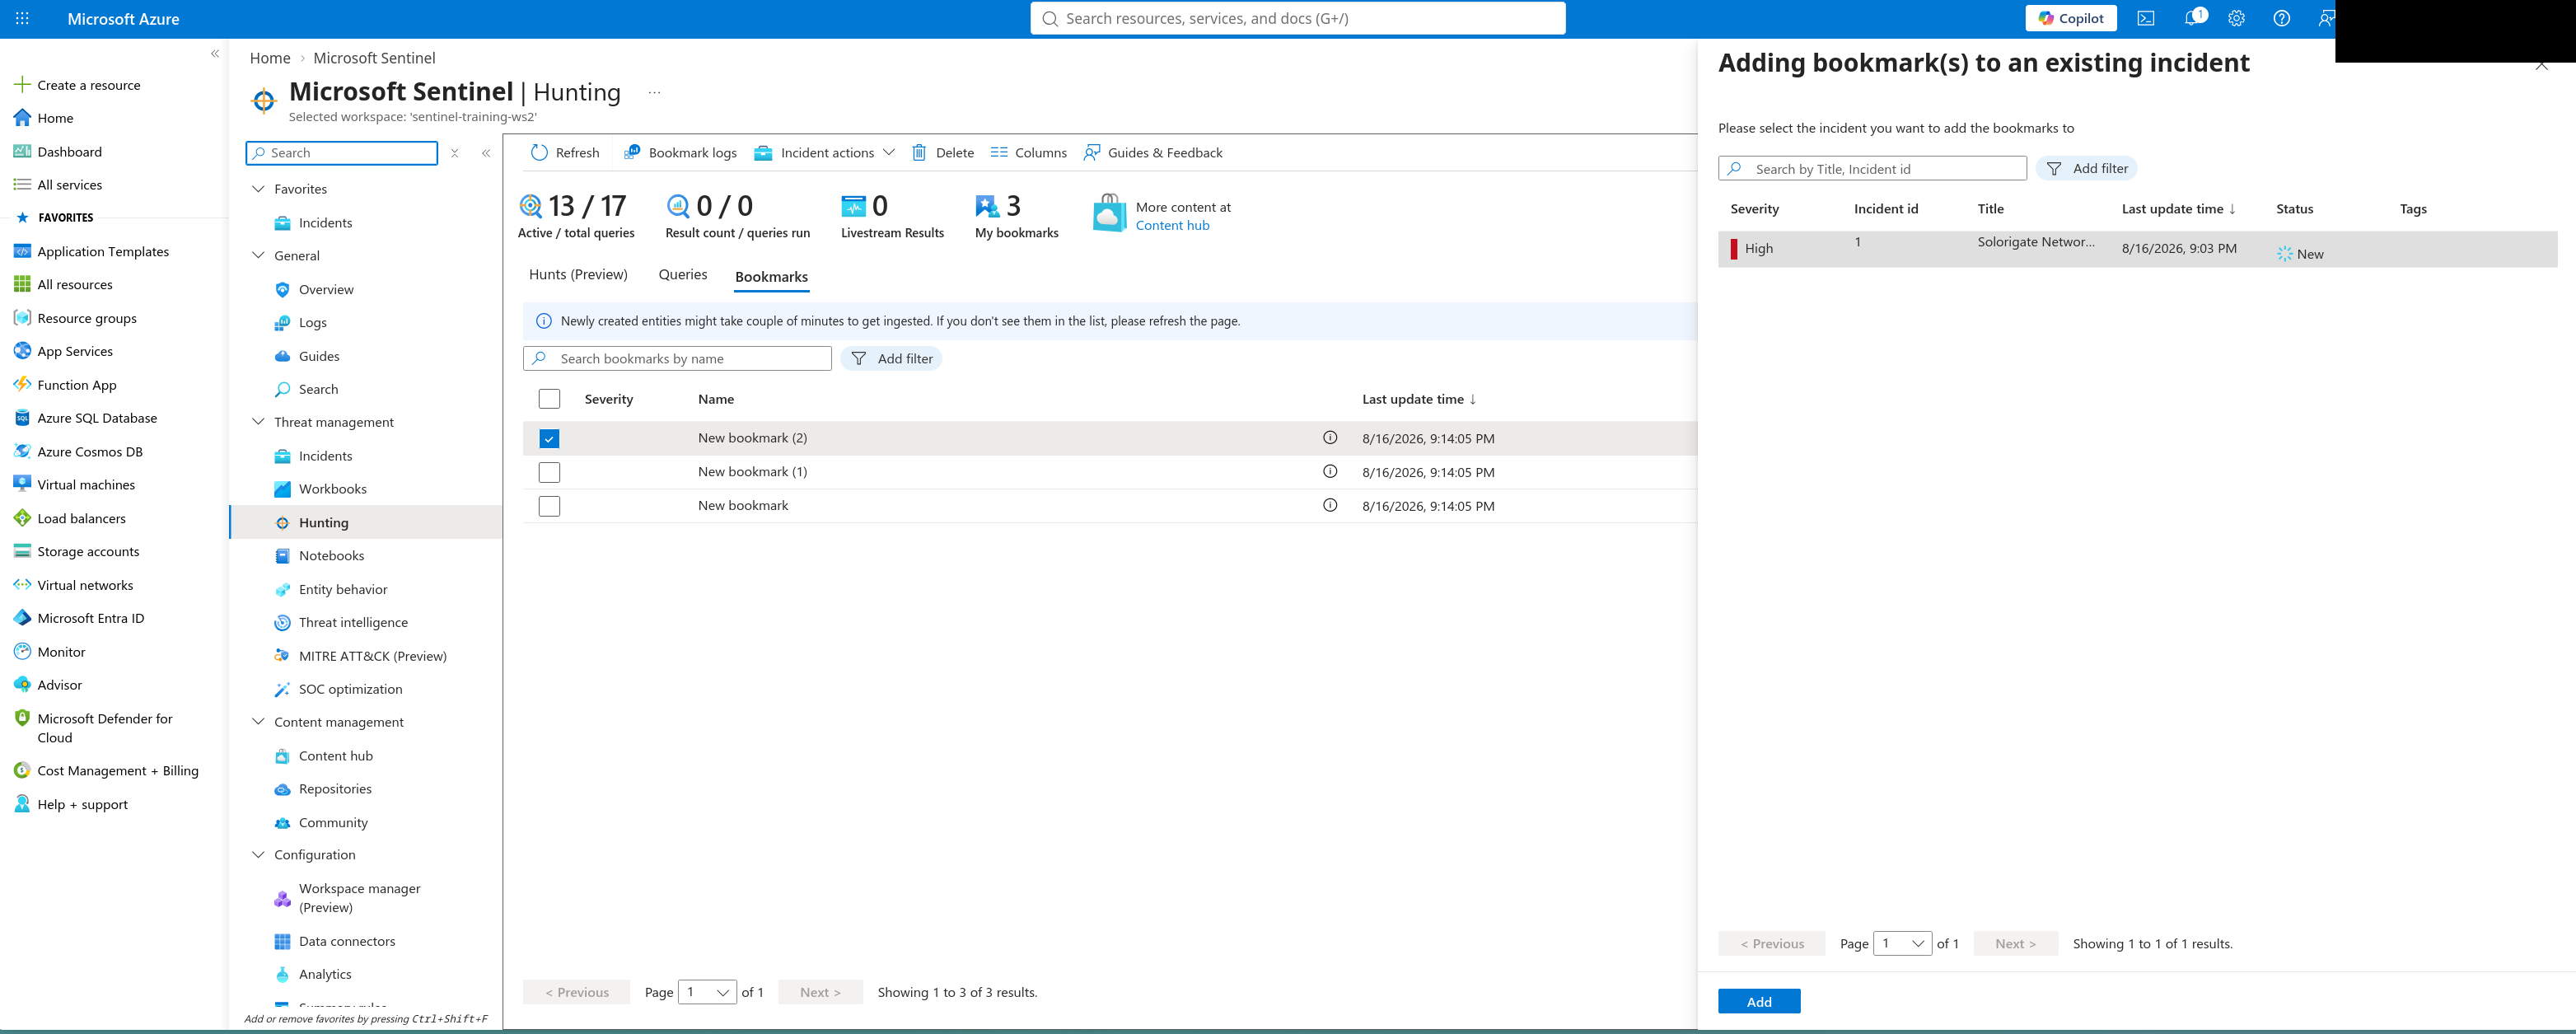
All three got bookmarked together and folded into the existing incident, keeping the evidence attached to the case rather than scattered across separate query results.
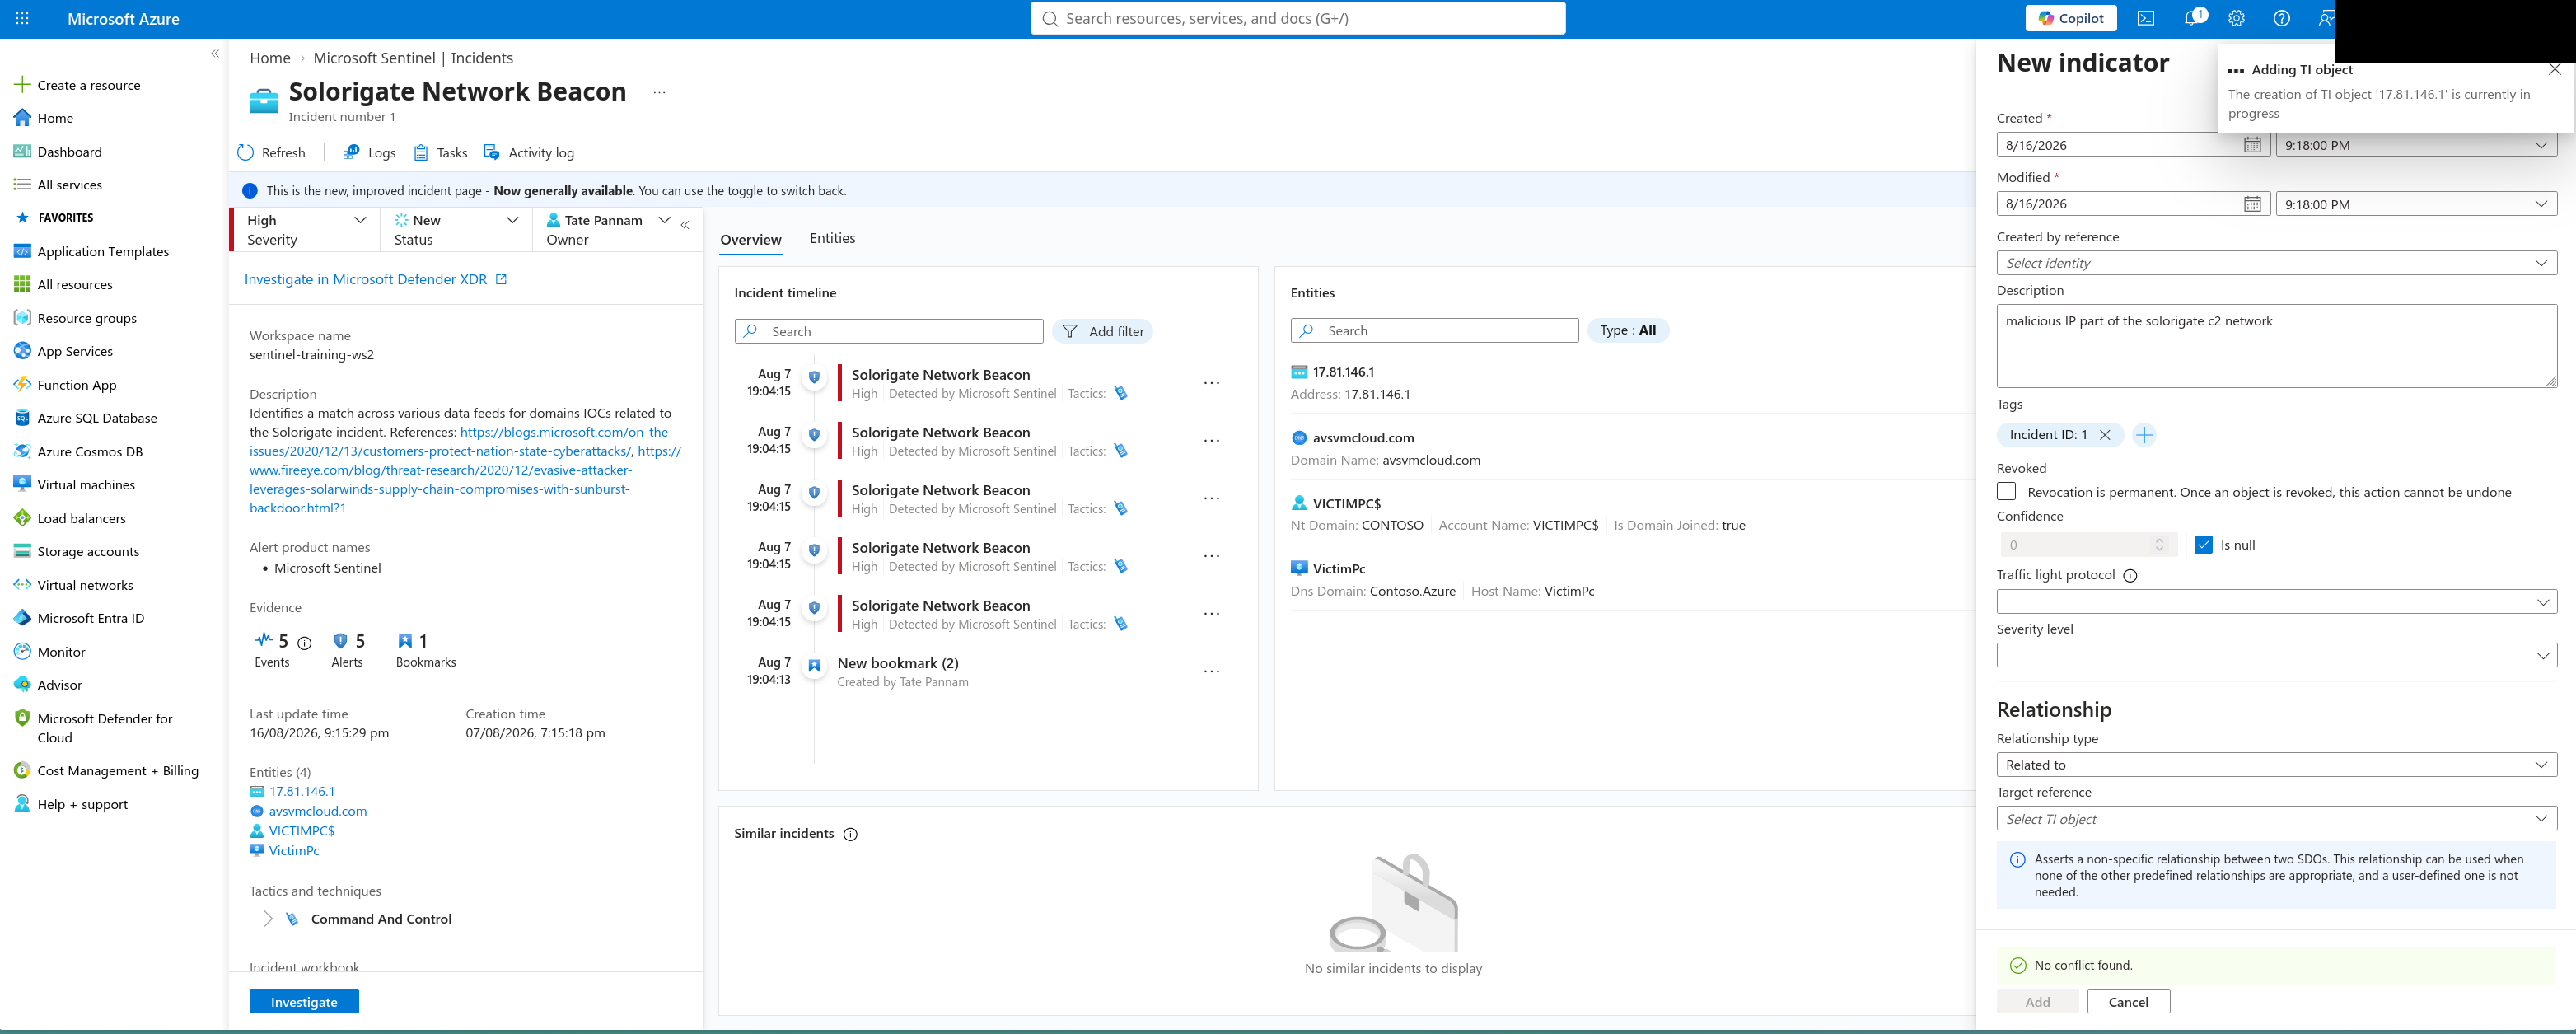
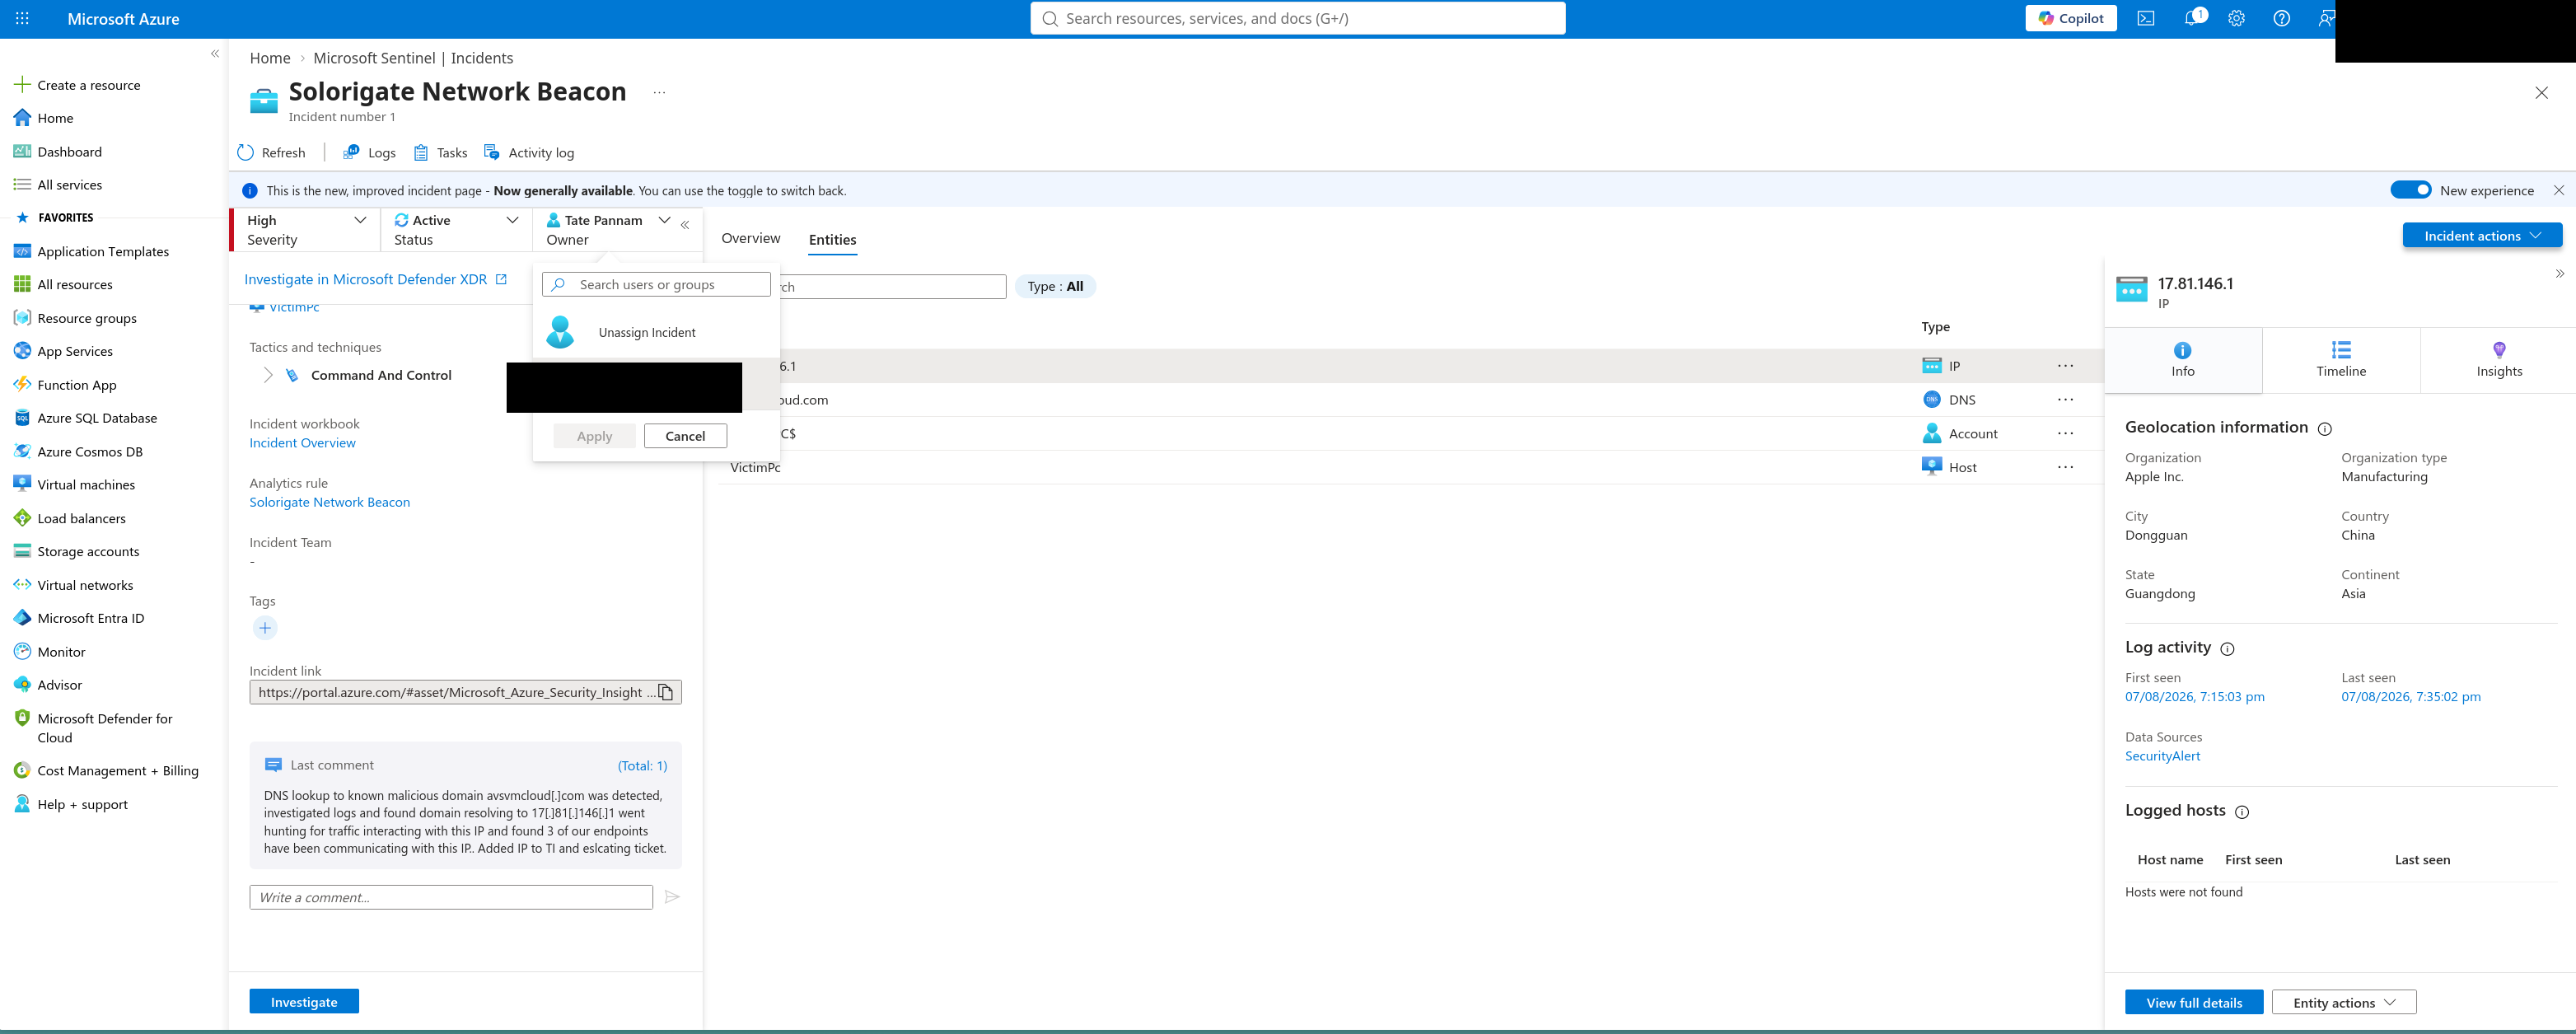
 The campaign’s IP indicator went into Threat Intelligence with a two-month validity window, so any recurrence gets caught automatically instead of requiring the same manual hunt again.
 And the incident closed with a documented handover rather than a resolution — findings written up in the comments, ownership moved to L2 (or the incident link shared out-of-band), the same instinct as Part 2’s ServiceNow work note but staying inside Sentinel instead of handing off to a separate system.
Also completed: the rest of the official Training Lab
The remaining four modules — Hunting, Watchlists, Threat Intelligence, and Content Hub — were worked through in full but aren’t documented as separate deep-dives here; walking someone else’s public tutorial step-by-step doesn’t demonstrate much beyond following instructions, and this page is about what was built and investigated, not what was completed. Listed for completeness: technique-filtered hunting correlated against a high-risk-app watchlist via KQL join, a second watchlist used to suppress known pentest traffic at the rule level, a manually-added Threat Intelligence indicator confirmed in the ThreatIntelligenceIndicator table, and a full Content Hub Solution install verified across Analytics, Workbooks, Hunting, and Watchlists.
Part 6 — A Third Environment: Real Defender for Endpoint on a Live Tenant
Parts 1-5 both ran against Sentinel workspaces designed to be safe to break — synthetic incidents, a disposable attack range. This part is different on purpose: a genuine Microsoft 365 E5 tenant, a real Azure subscription behind it, an actual endpoint onboarded to Microsoft Defender for Endpoint. Nothing here is scripted or pre-seeded — every signal in this section came from something the environment itself generated in response to real actions, and every wall it hit was a real property of a fresh tenant rather than a lab quirk.
First signal
Onboarding the endpoint to Defender for Endpoint via the Local Script method was uneventful once the script was actually on the box — the one wrinkle worth noting is that the onboarding “package” is just a small text .cmd file, not an installer, which matters if you’re working over RDP with a finicky clipboard: it copy-pastes cleanly through Notepad rather than needing a real file transfer.
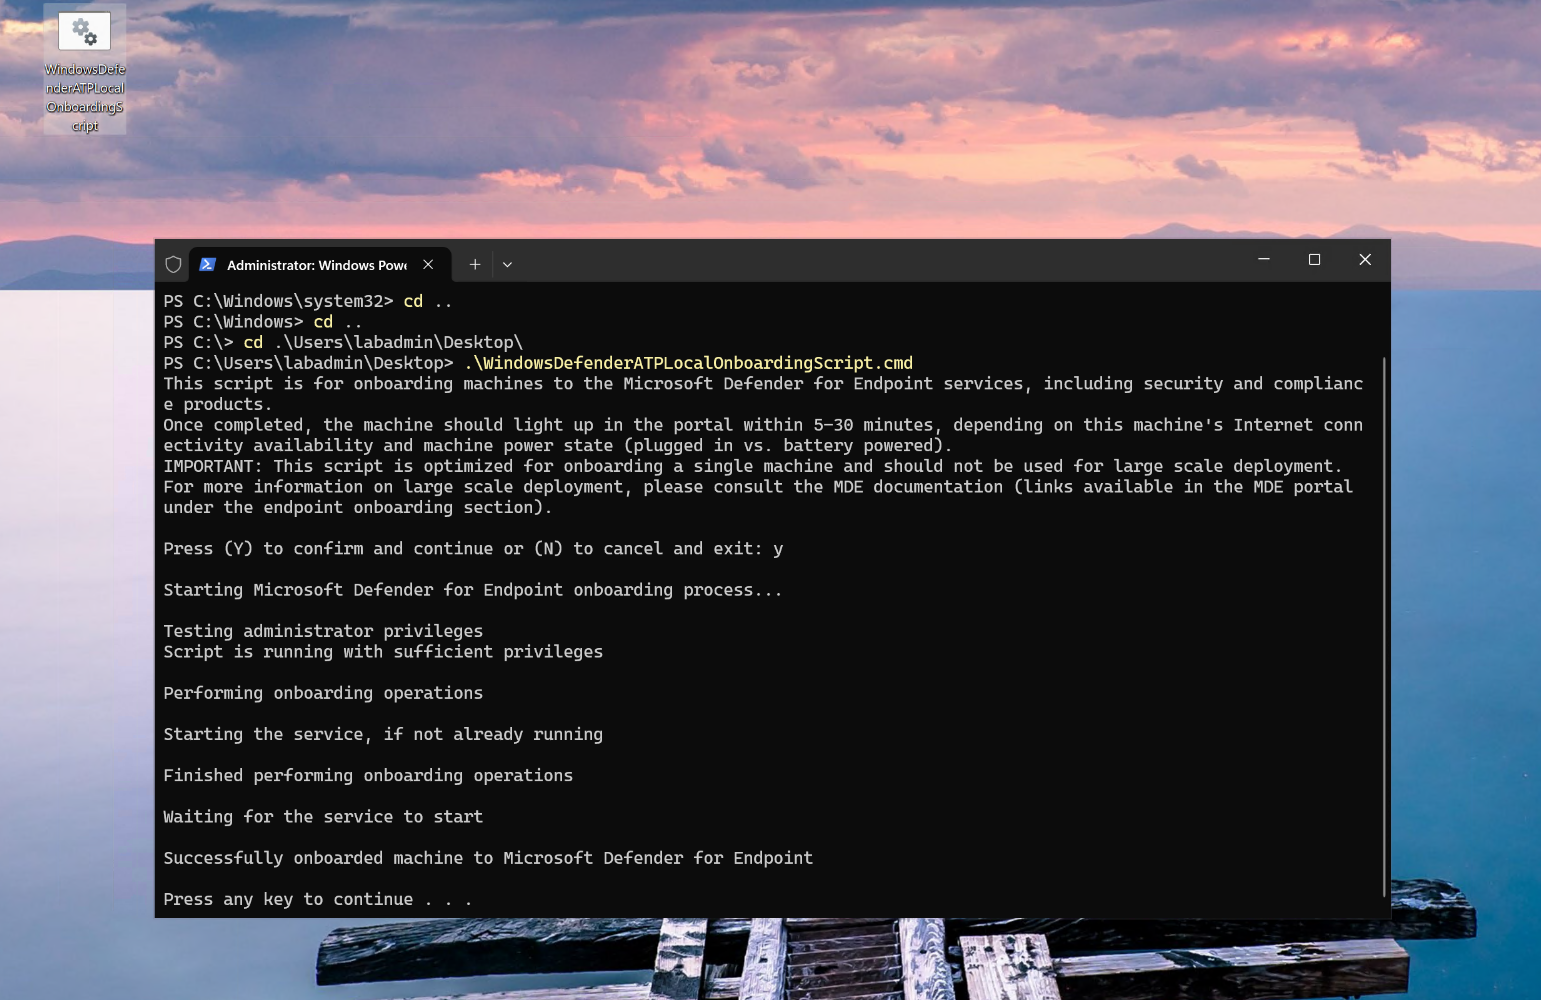 Onboarding completing cleanly —
 Successfully onboarded machine to Microsoft Defender for Endpoint.
The detection test that follows onboarding is where the interesting problem showed up. Microsoft’s own documented command is meant to run from cmd.exe, not PowerShell:
powershell.exe -NoExit -ExecutionPolicy Bypass -WindowStyle Hidden $ErrorActionPreference= 'silentlycontinue';(New-Object System.Net.WebClient).DownloadFile('http://127.0.0.1/1.exe', 'C:\test-WDATP-test\invoice.exe');Start-Process 'C:\test-WDATP-test\invoice.exe'Run at an existing PowerShell prompt instead, it fails in a way that looks like a corrupted paste:
Continue= : The term 'Continue=' is not recognized as the name of a cmdlet, function, script file, or operable program.
It isn’t corruption. The outer PowerShell session parses the line before handing it to the nested powershell.exe call, and pre-expands $ErrorActionPreference — whose default value is the literal string Continue — against the immediately-following =, producing the token Continue=. Cmd.exe has no such pre-parsing step, so the same line run there is handed to the child process untouched and executes exactly as written.
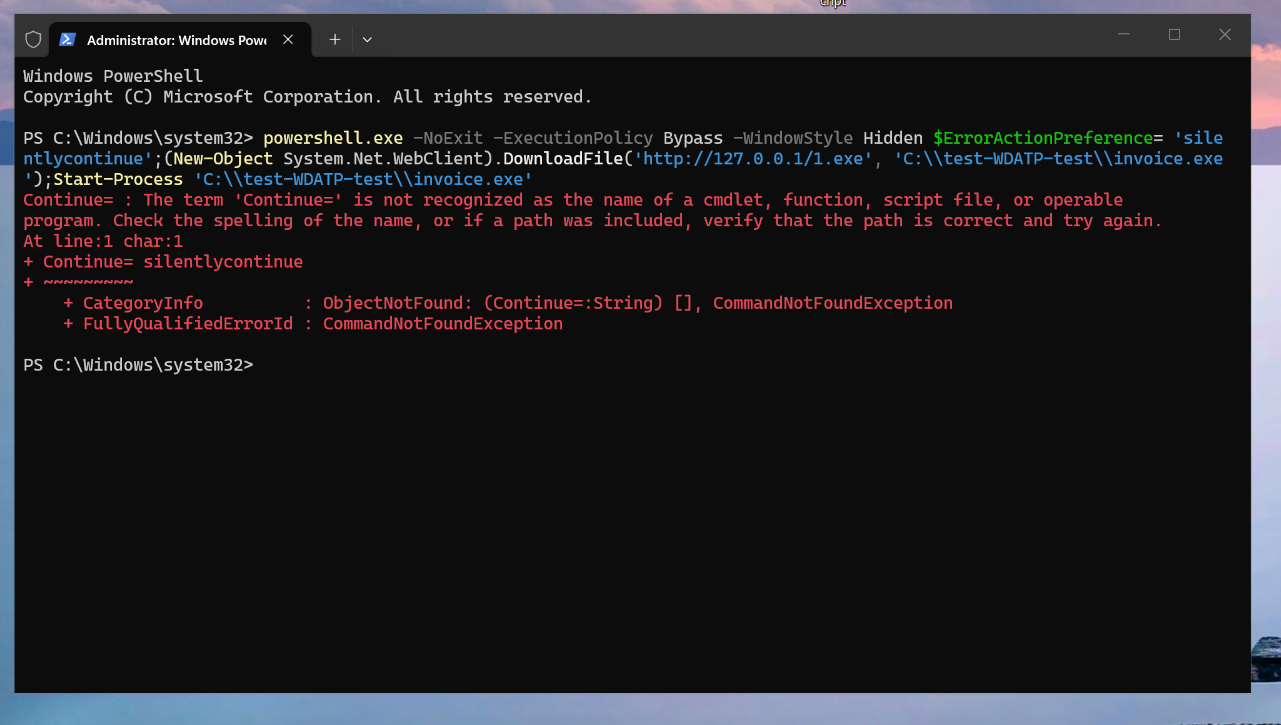 The failure as it first appears — a plausible-looking parse error that’s actually the outer shell rewriting its own input.
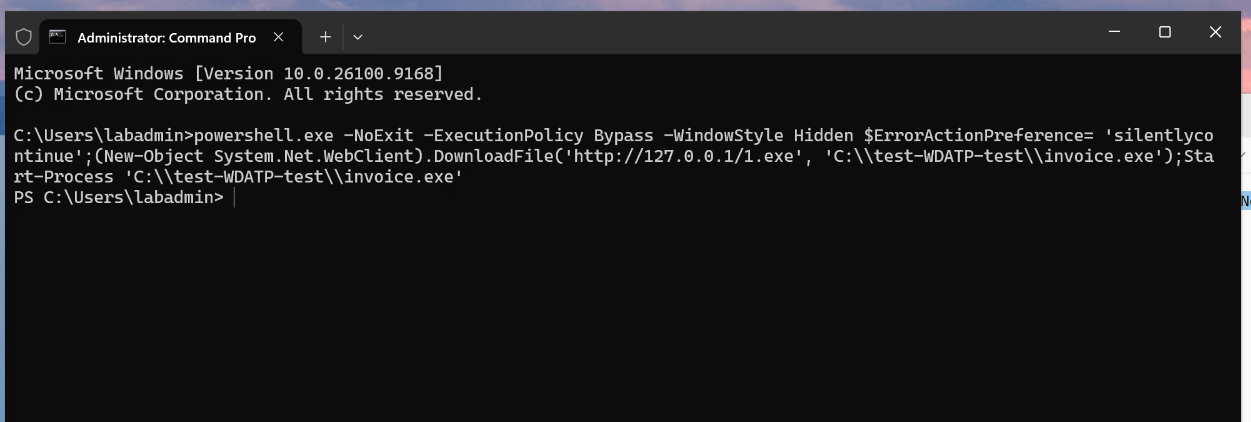 The same command, unmodified, run from an elevated Command Prompt instead — clean.
That distinction is the whole finding: it’s not a broken command, it’s two different shells parsing the same text two different ways, and the fix is choosing the right one rather than editing anything.
The first real incident
A few minutes later, a genuine incident was sitting in the queue — not a seeded scenario, the actual product reacting to the actual test file.
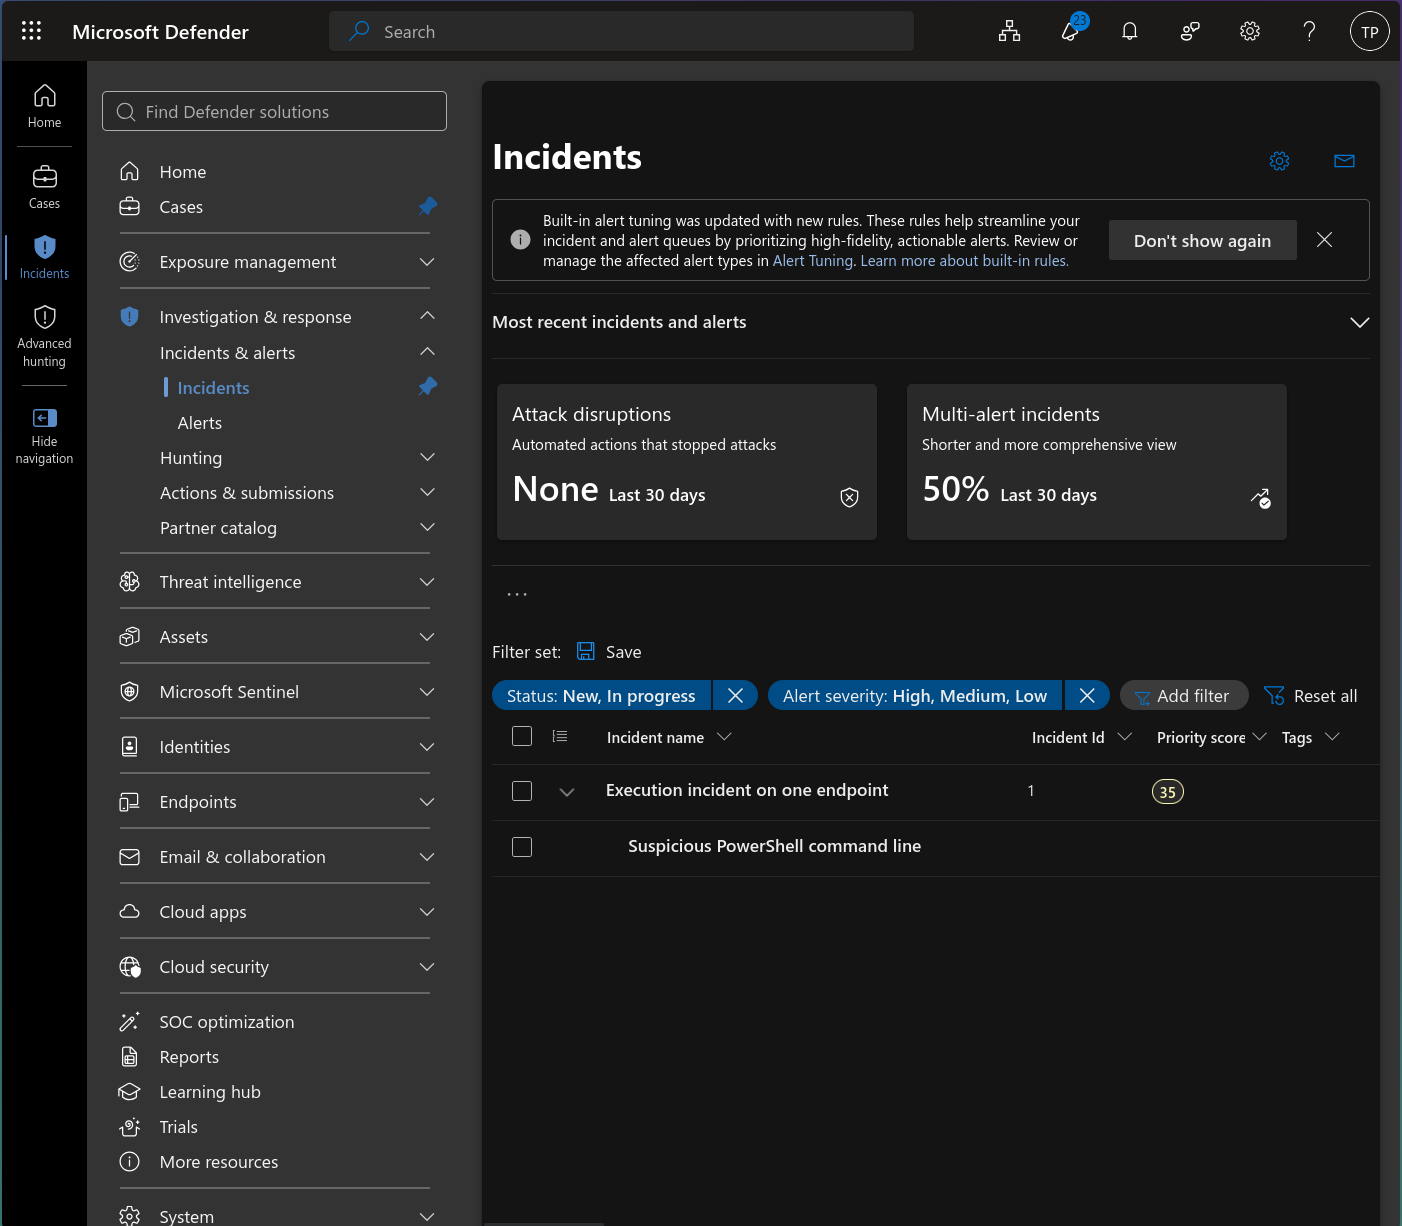
Execution incident on one endpoint, with a Suspicious PowerShell command line alert underneath it.
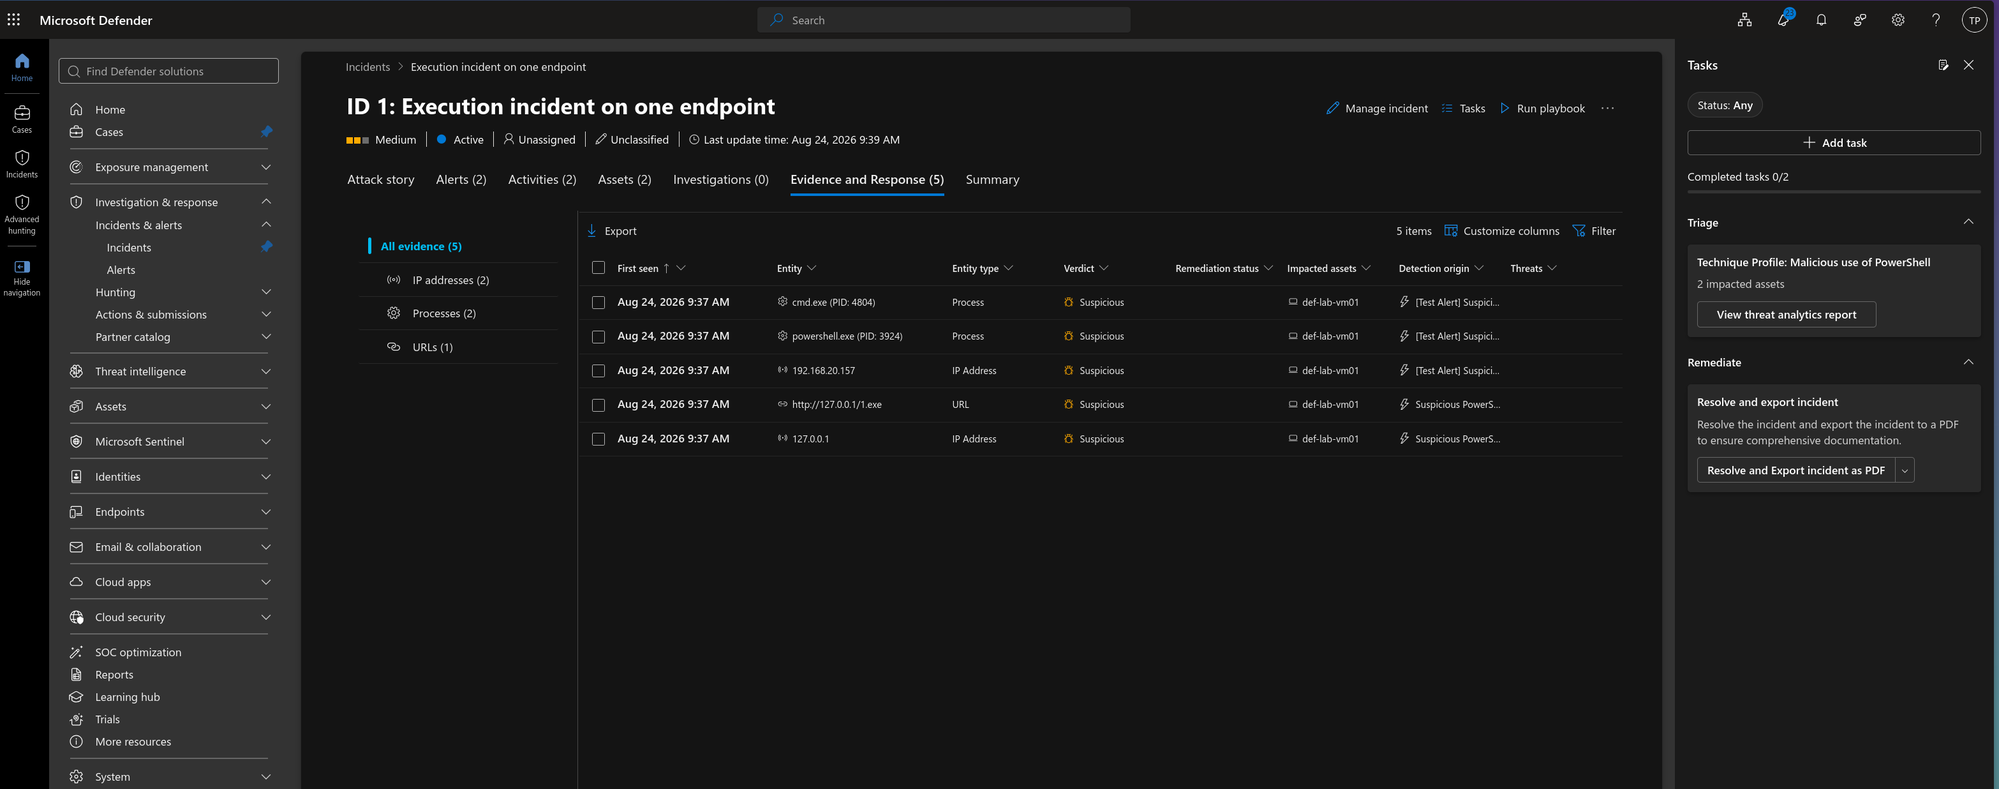 The full evidence chain behind it:
 cmd.exe spawning powershell.exe, the outbound connection to 127.0.0.1, and the invoice.exe write, all correlated automatically and tagged against a “Malicious use of PowerShell” technique profile — the same shape of automatic entity correlation Part 3’s Sentinel incidents show, produced here by Defender for Endpoint’s own EDR engine instead.
The same incident, extended: AMSI catches what execution alone didn’t
A second, genuinely different technique was worth testing against the same endpoint: rather than a dropped executable, an in-memory PowerShell payload run through Invoke-Expression, designed to trip the Antimalware Scan Interface (AMSI) — Defender’s hook into the script engine itself, built specifically for fileless and dynamic-script attacks that never touch disk as a file.
$testString = "AMSI Test Sample: " + "7e72c3ce-861b-4339-8740-0ac1484c1386"
Invoke-Expression $testString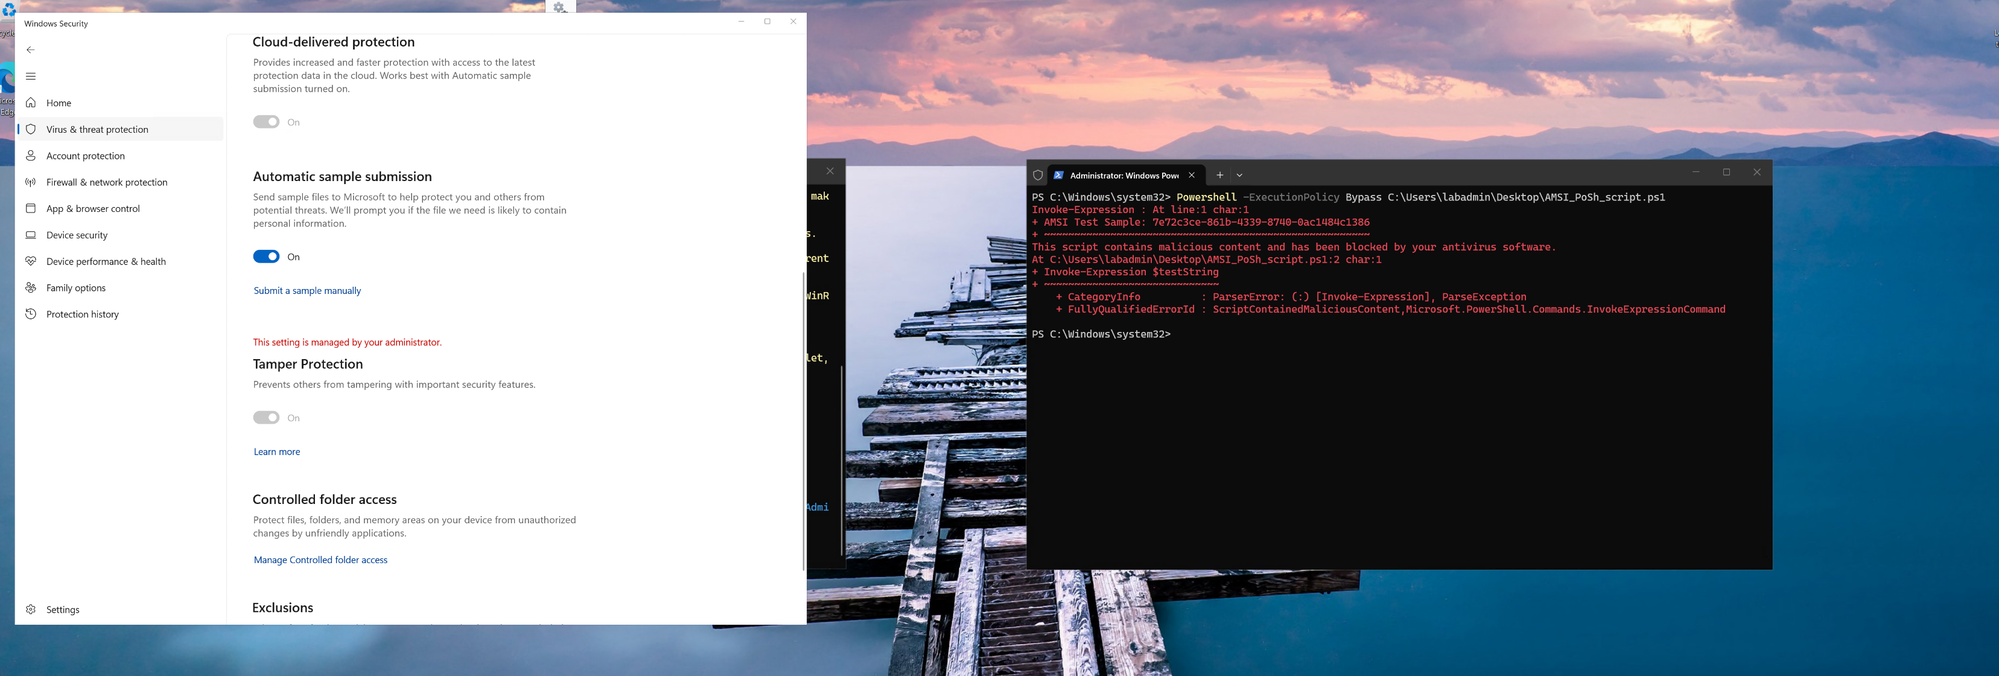 Blocked before it ever ran:
 This script contains malicious content and has been blocked by your antivirus software.
The interesting part wasn’t the block itself, it was where the resulting alert landed: not a new incident, but folded into the same one from earlier.
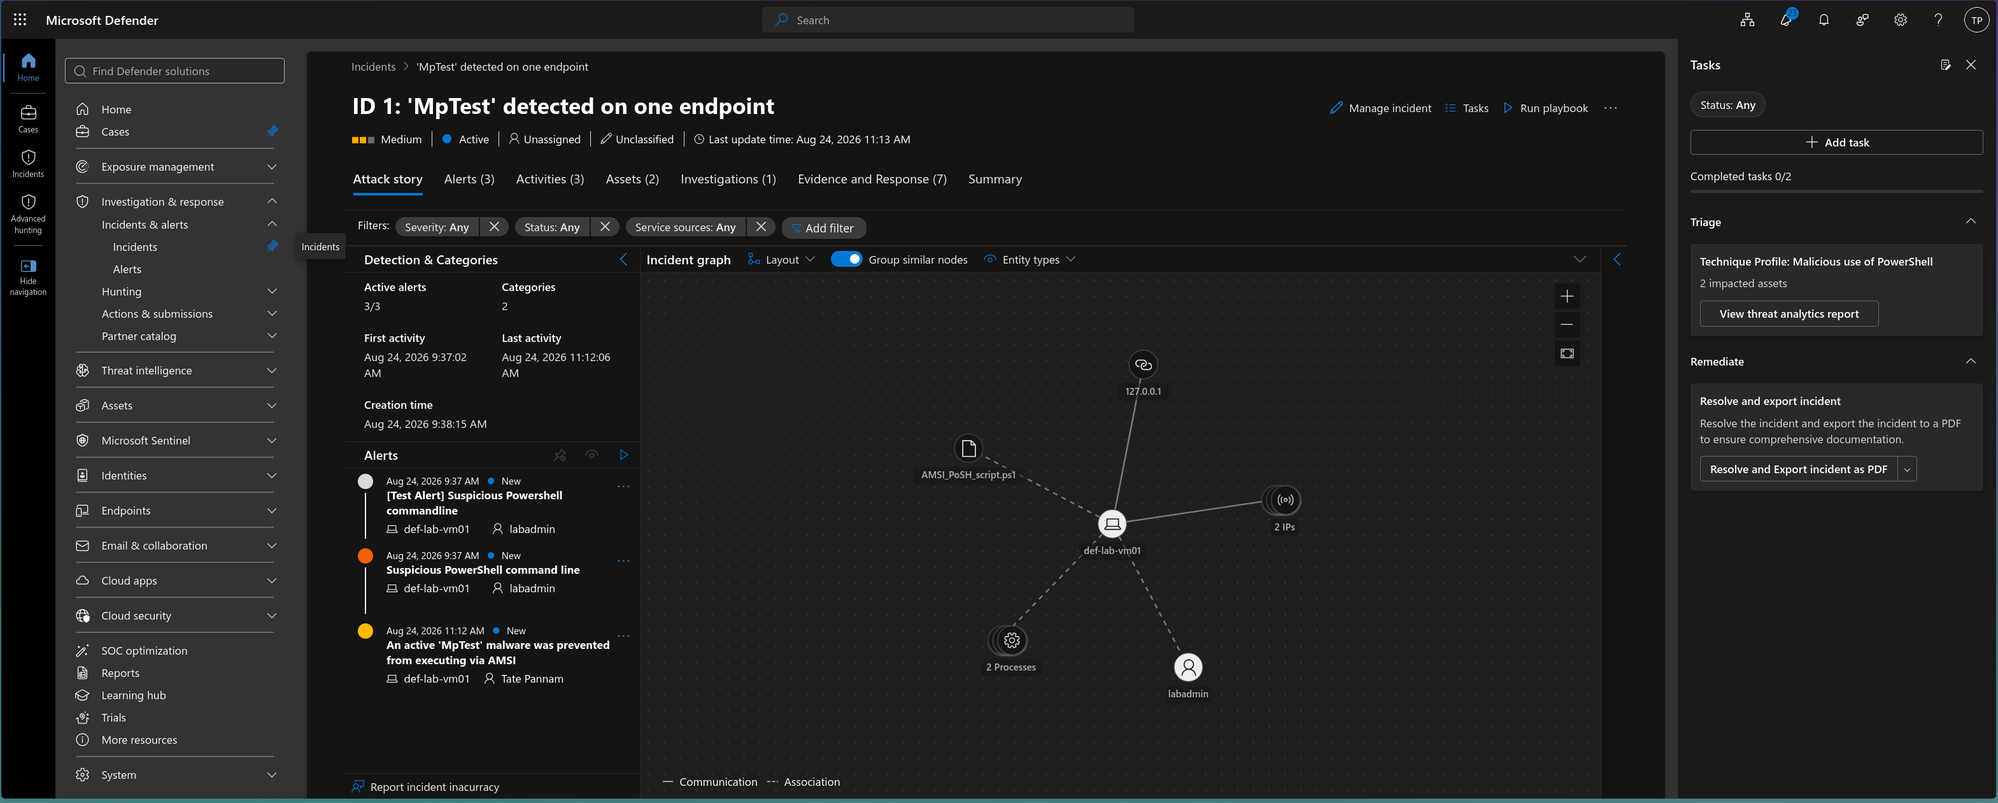 Same incident ID, now retitled
 'MpTest' detected on one endpoint, three alerts deep — the original execution test, the suspicious PowerShell command line, and now An active 'MpTest' malware was prevented from executing via AMSI — all correlated against the same host rather than fragmented into separate tickets.
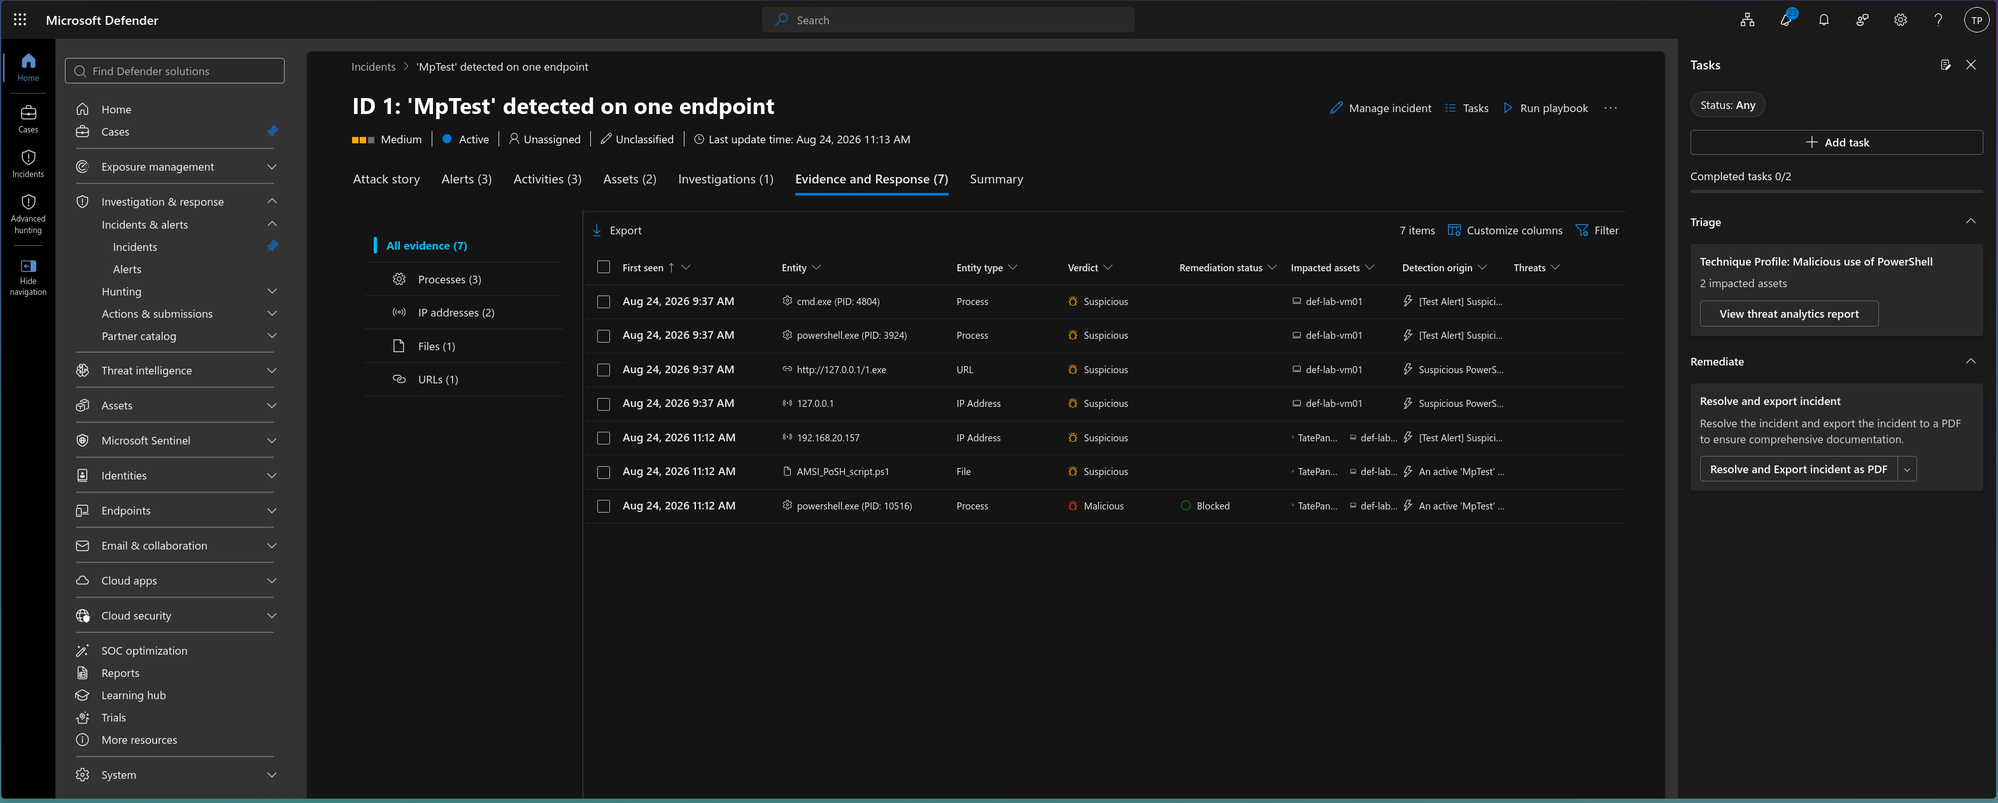 The evidence list grew from 5 items to 7, and the verdict language shifted with it: the earlier PowerShell activity sits at Suspicious, but this process is marked Malicious, remediation status Blocked. Not just flagged this time; actually stopped in real time. That distinction is worth more than a second standalone incident would have been — it shows the incident-correlation engine treating repeated activity on one host as an evolving case rather than alert-fatigue noise, and shows Defender’s own verdict language distinguishing “worth a look” from “actively prevented.”
Chasing a tutorial that no longer exists
The next step on paper was Microsoft’s own Tutorials & simulations feature — three built-in scenarios (a dropped-backdoor document, a fileless PowerShell attack, and an automated-investigation walkthrough) documented as living under Endpoints → Evaluation & tutorials. That menu path doesn’t exist in the current portal.
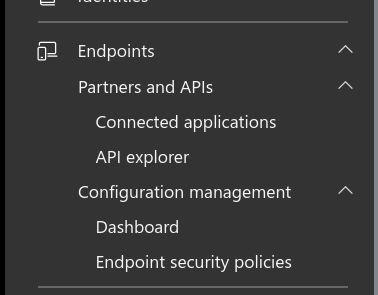 The full Endpoints menu, expanded — no Evaluation & tutorials category anywhere in it.
Pulling the current Microsoft Learn page for it resolves to a different document entirely: Microsoft Defender for Endpoint demonstration scenarios, last updated June 2026. The single hub page with launchable buttons has been retired in favor of a catalog of individually-documented demonstrations organized by protection area (Attack Surface Reduction, Next-Gen Protection, EDR), each run manually by following its own guide rather than through a portal wizard. Worth flagging here, since anyone following an older guide or a cached search result will hit the same dead menu.
Attack Simulation Training, and a tenant that hadn’t been unlocked yet
An adjacent but distinct feature — Attack Simulation Training, under Email & collaboration — turned out to be the right home for the phishing-campaign piece of this build. A Credential Harvest simulation was built targeting the tenant’s own mailbox, but the Simulations list is explicit about state rather than assuming: it landed as Draft, not launched, which is worth checking rather than trusting the wizard’s summary screen.
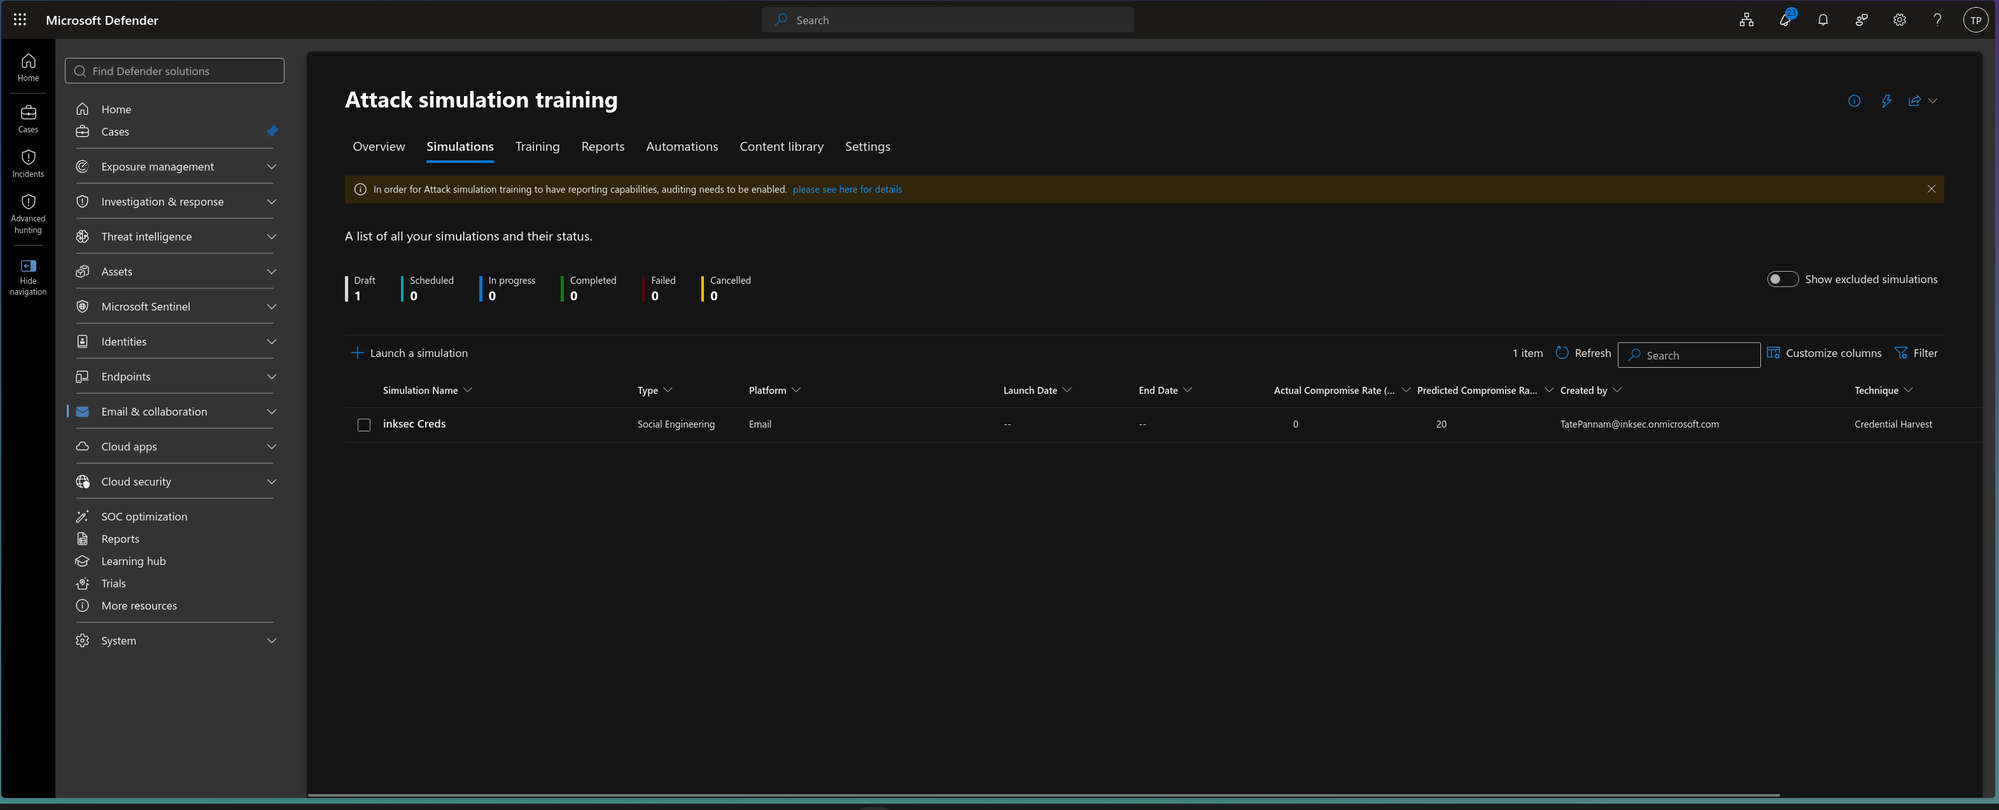 Draft: 1, everything else: 0 — the actual state, confirmed from the dashboard rather than assumed.
Turning on reporting for it surfaced a real backend gate. The portal’s own “Start recording user and admin activity” control failed with:
Microsoft.Exchange.Configuration.Tasks.InvalidOperationInDehydratedContextException: The command you tried to run isn't currently allowed in your organization. To run this command, you first need to run the command: Enable-OrganizationCustomization.The exact error, reproduced identically on a second attempt through the UI — ruling out a one-off glitch.
This is a known property of brand-new Exchange Online tenants: several organization-level settings, unified audit log ingestion among them, stay locked until Enable-OrganizationCustomization is run once against the tenant. It isn’t exposed anywhere in the Purview or Defender portals — only in Exchange Online PowerShell:
Connect-ExchangeOnline -UserPrincipalName TatePannam@inksec.onmicrosoft.com
Enable-OrganizationCustomization
Set-AdminAuditLogConfig -UnifiedAuditLogIngestionEnabled $true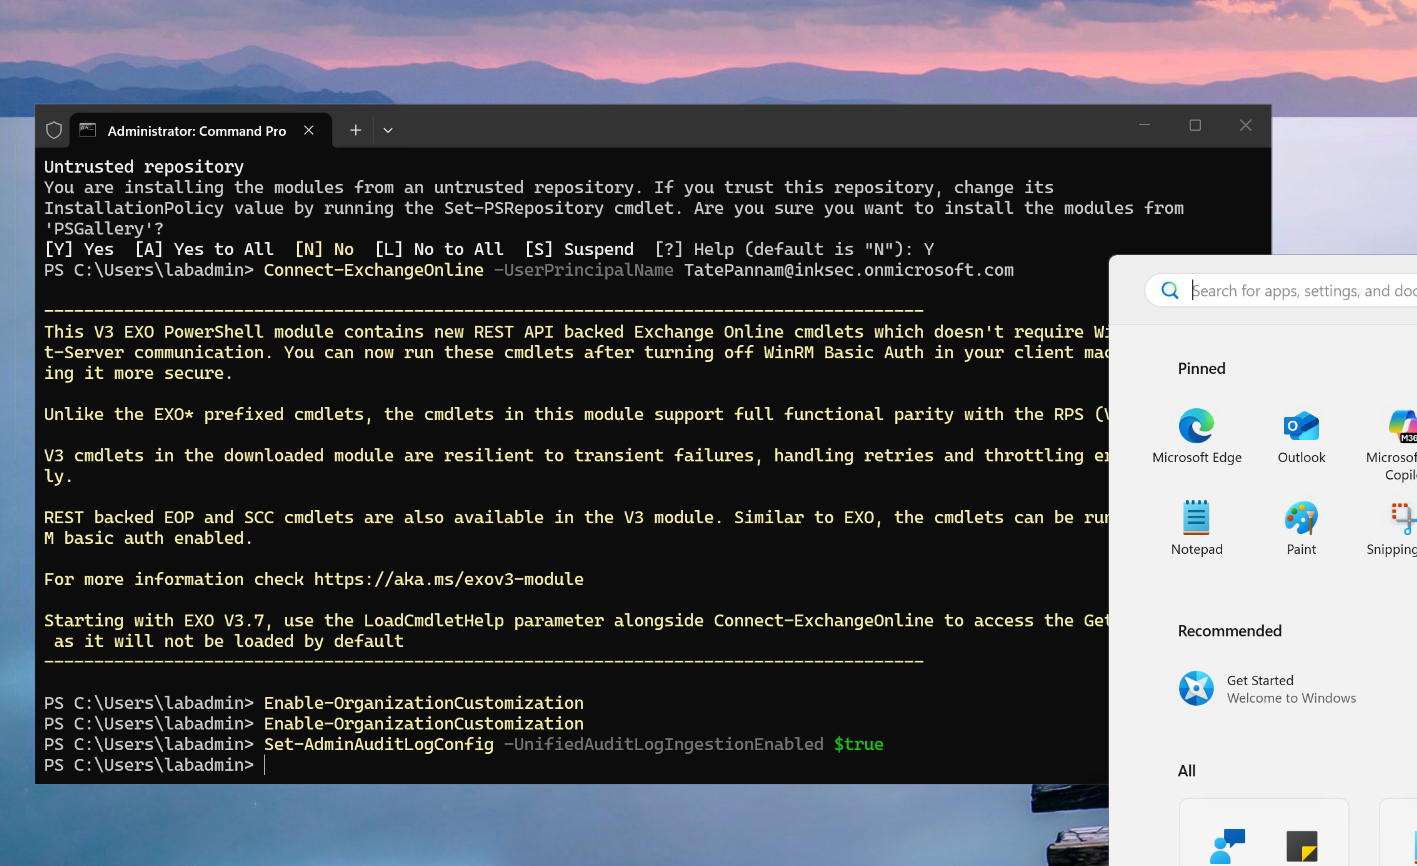 Both commands returning cleanly, no output and no error — the tenant unlocked, config set. The Purview UI itself kept showing the old cached error until a hard refresh; the config change was already correct underneath it.
Closing the loop: launching the campaign for real
With auditing unlocked, the campaign went from draft to a real, tracked run — Credential Harvest technique, a “Black Friday Offer” payload, targeting the tenant’s own mailbox.
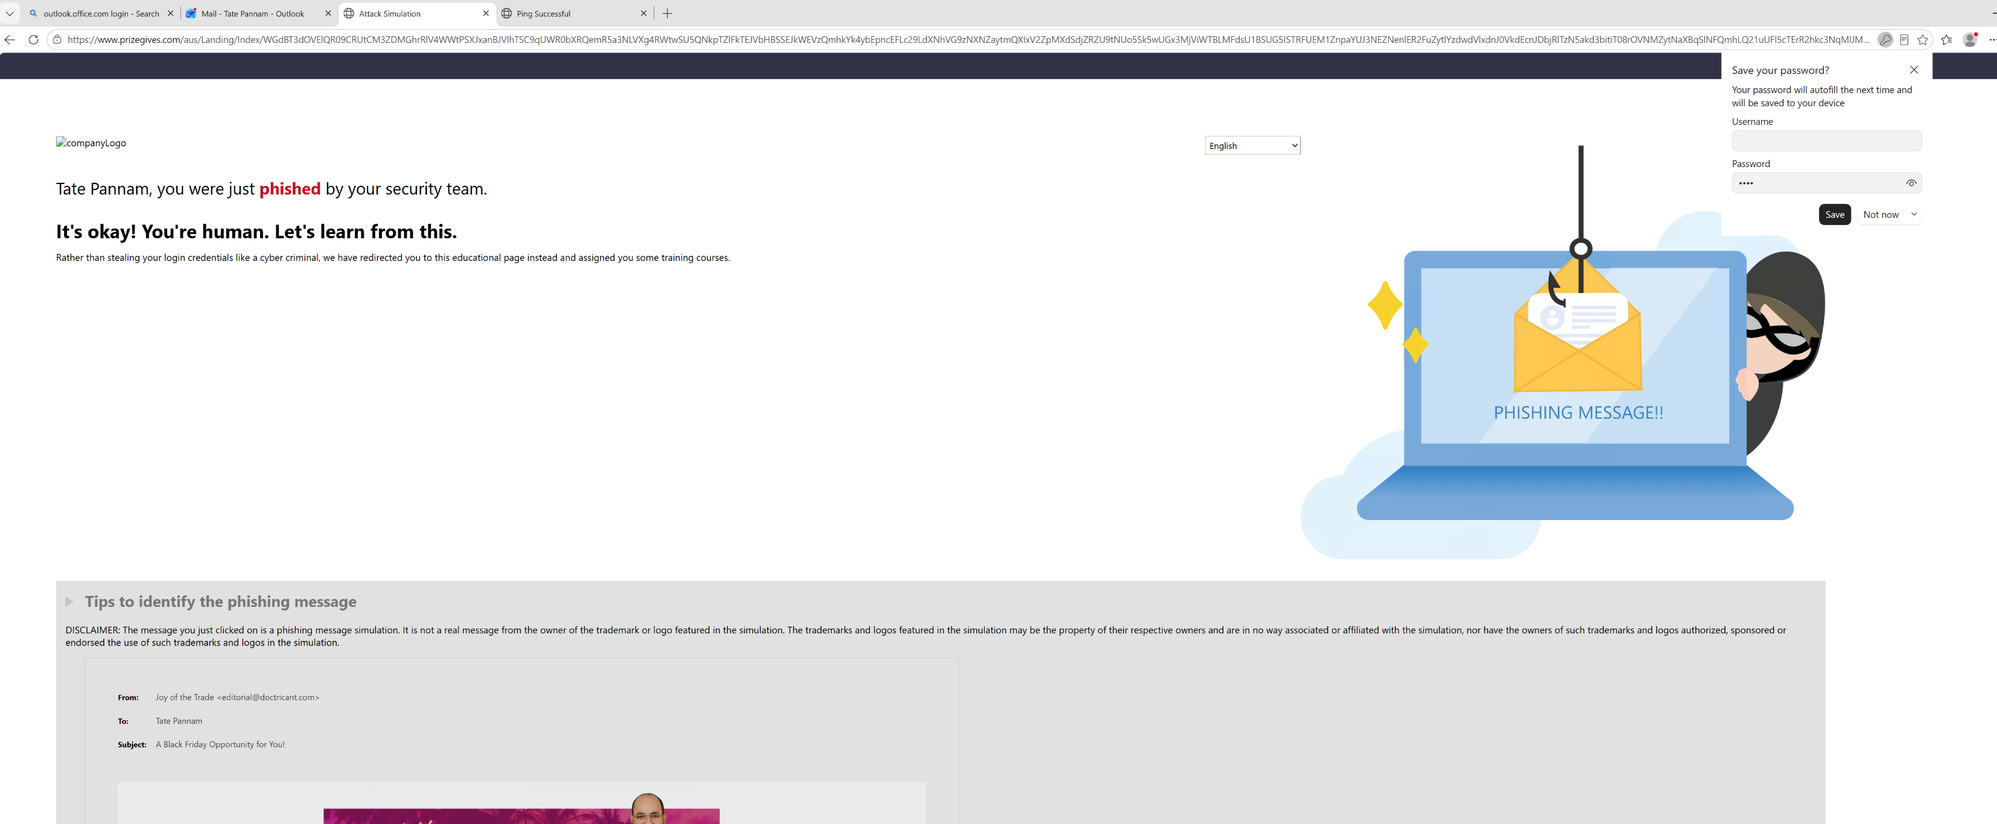 The result of clicking through: Microsoft’s own safe landing page, not a real credential capture — “you were just phished by your security team,” with the actual sender header behind the display name broken down underneath as the teaching moment.
The follow-through happened without any further action — a training-assignment email arrived automatically off the back of the click, reproducing the original phishing message inline so the same red flags can be reviewed at leisure.
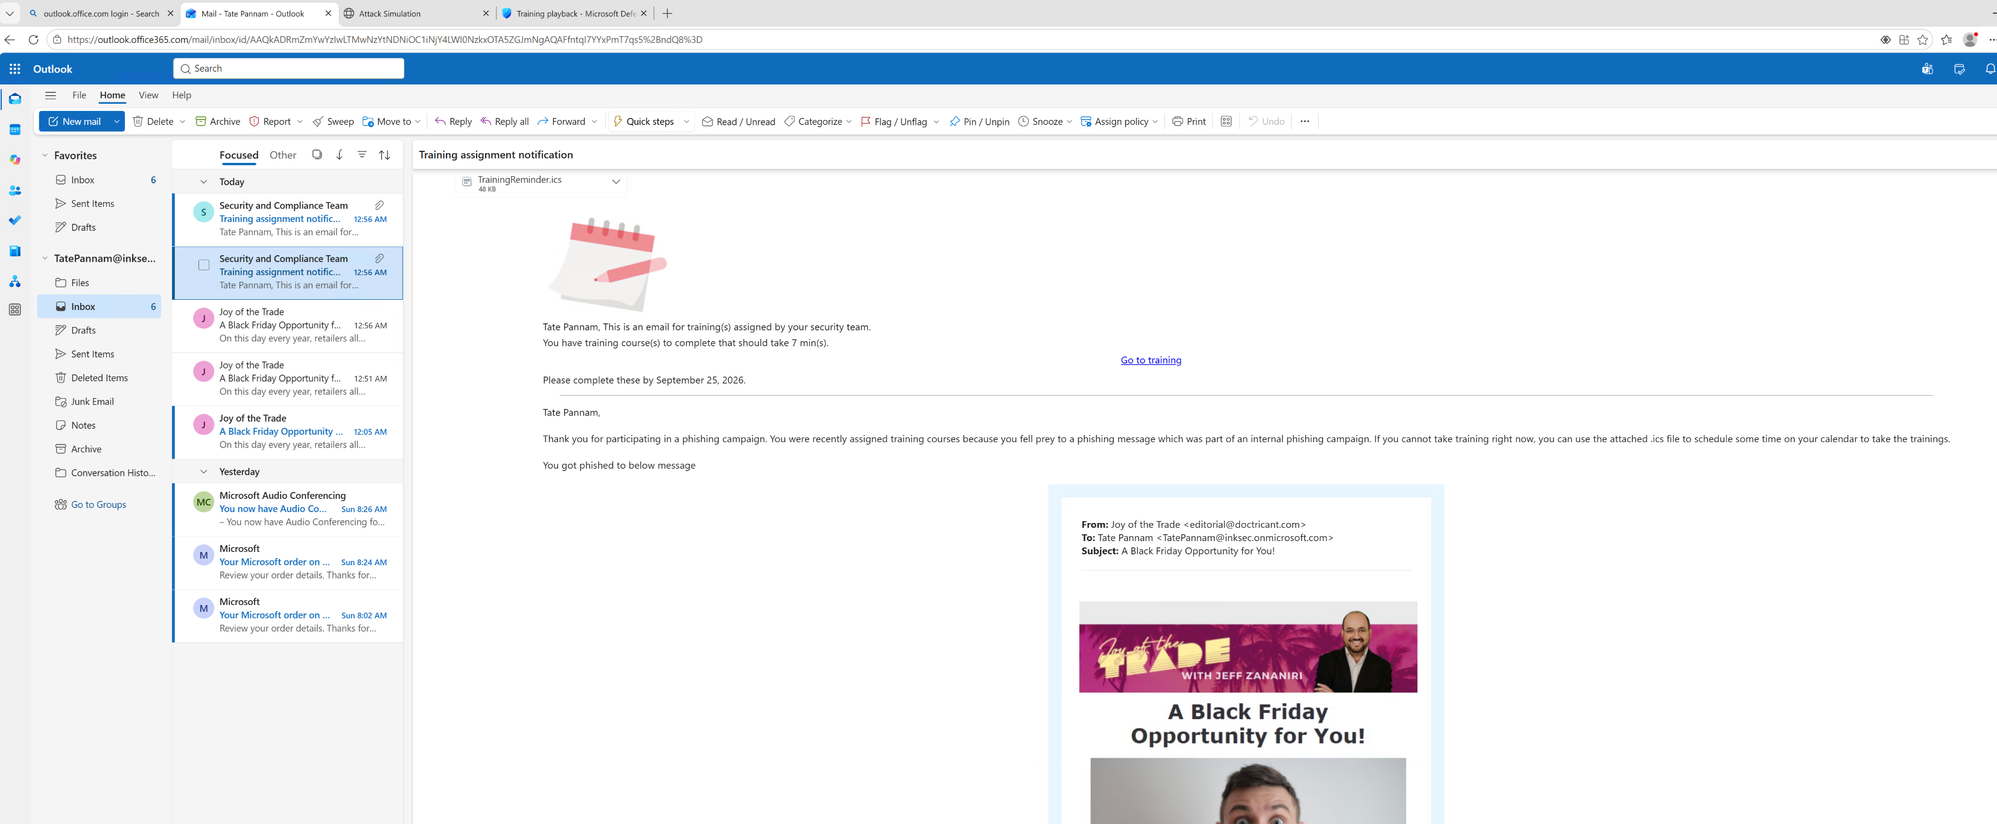 Automatic training assignment, generated because a real compromise was recorded — not a separate manual step.
The simulation’s own report confirms the full chain, timed to the second: first link click at 15 seconds, first credential entered at 36 seconds, 100% of targeted users compromised.
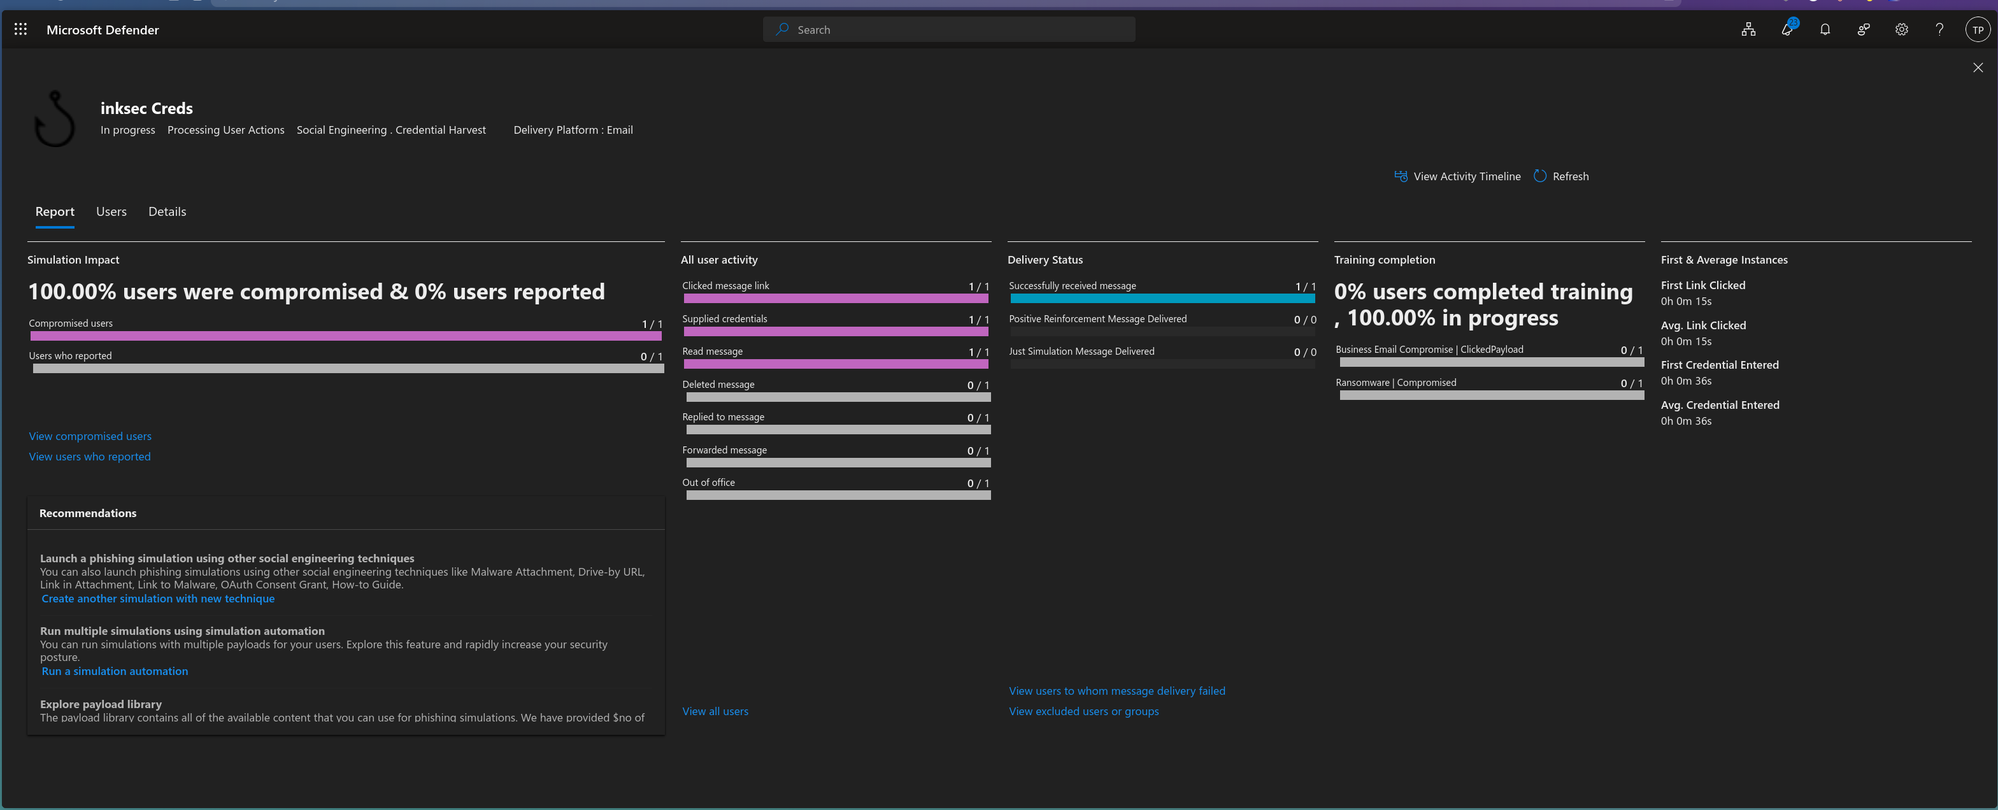 The report Defender itself produces off this run — delivery, click, credential-entry, and training-assignment all tracked as one continuous chain rather than separate systems that happen to agree.
The throughline across Parts 1-5 was Sentinel against data that was already flowing. This part is the layer underneath that: what it actually takes to get a brand-new tenant, license, and endpoint into a state where any signal exists at all. The payoff for pushing through both real walls it hit is the same shape as Part 2’s closed loop: a real user action, tracked automatically end to end, with nothing about the outcome staged in advance.
Part 7 — From Endpoint to Identity: A Real Risky Sign-In
Part 6 stayed entirely on the endpoint: process execution, fileless script detection, a phishing click. This part moves to the other half of the identity fabric — Entra ID’s own risk engine, tested against a real sign-in rather than a simulated one.
Setting it up
The plan was simple: sign in as the tenant’s own admin account from a VPN egress far enough from its normal location to look genuinely anomalous, then check whether Entra ID Protection noticed. One adjustment made mid-test is worth including rather than editing out: an initial attempt reused an already-authenticated browser tab after switching VPN countries, which produces no new sign-in event at all — Entra doesn’t re-evaluate risk against a session that’s still holding a valid token, only against a fresh authentication. The actual test needed a genuine new sign-in: a fresh incognito window, full credential prompt, VPN connected first.
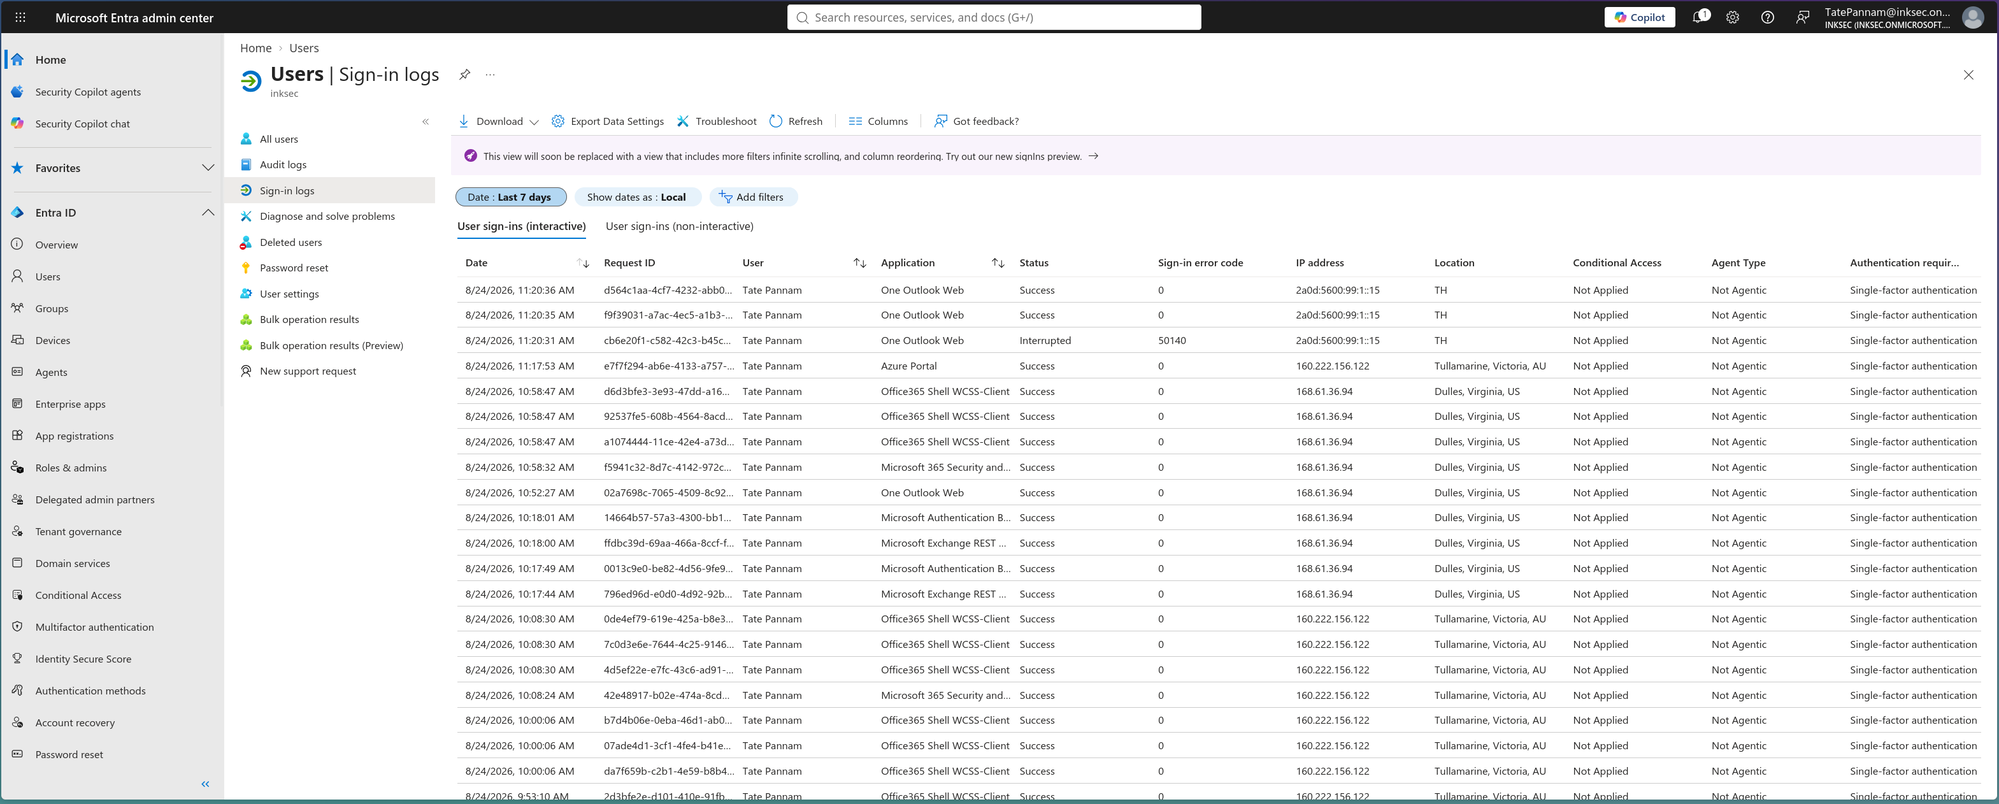 The real sign-in, captured cleanly in Entra ID’s Sign-in logs — Location
 TH, a distinct IPv6 address, clearly separated from the normal entries surrounding it.
The result
It fired.
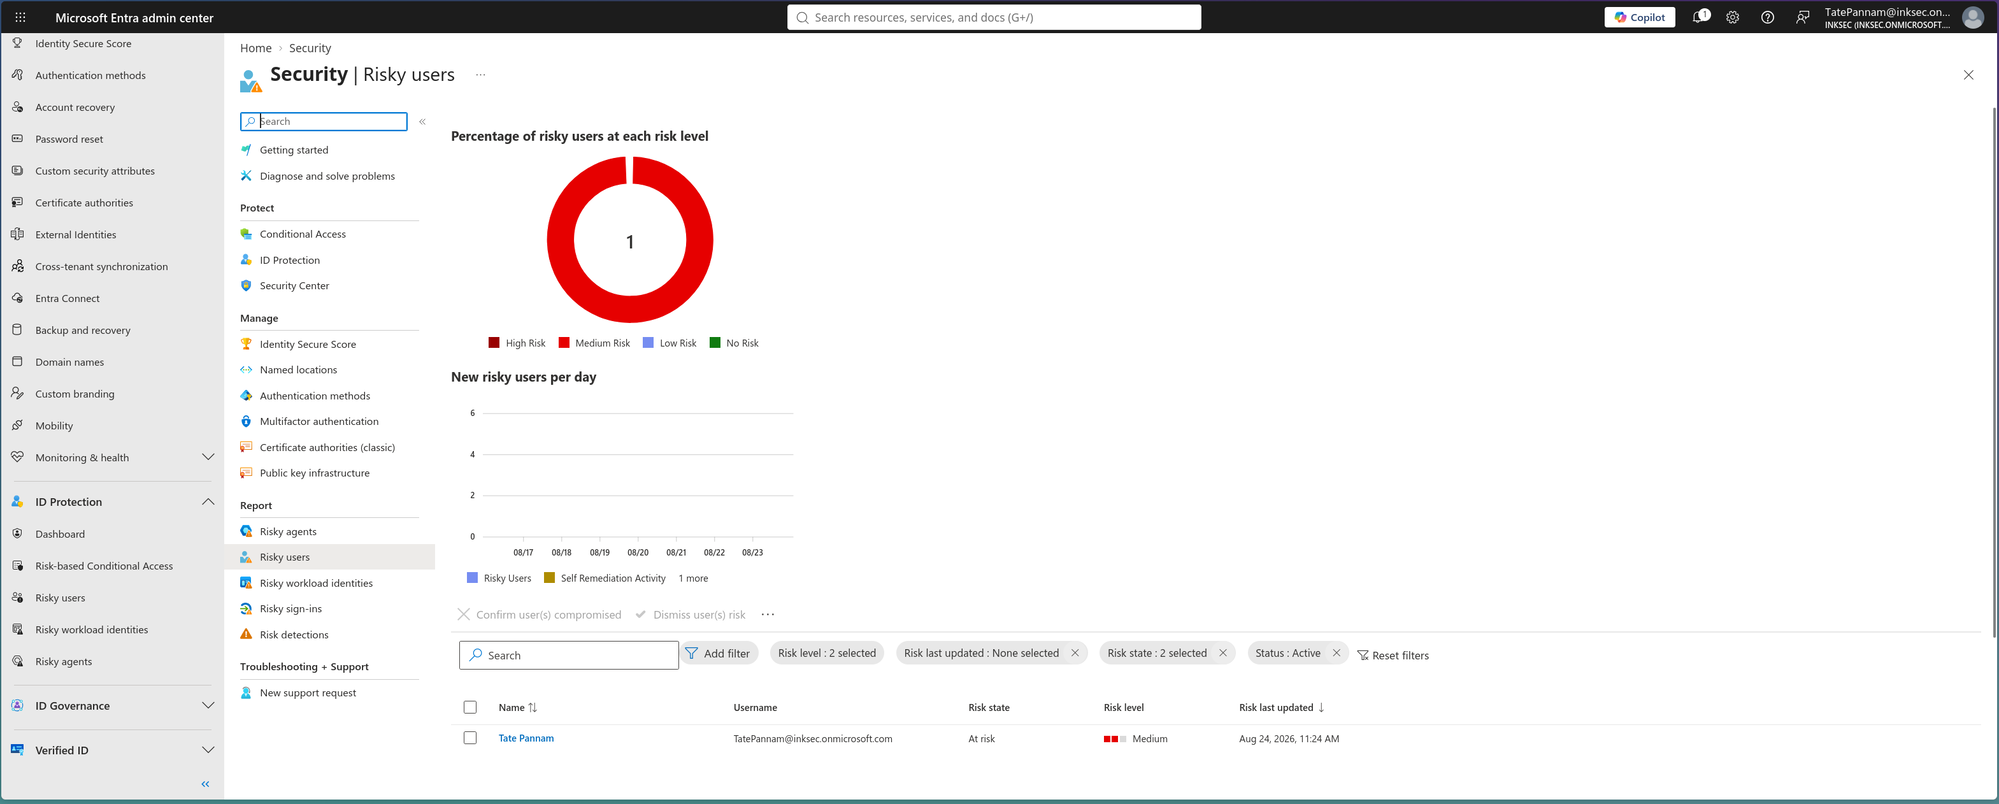 The account, flagged At risk, Medium risk level.
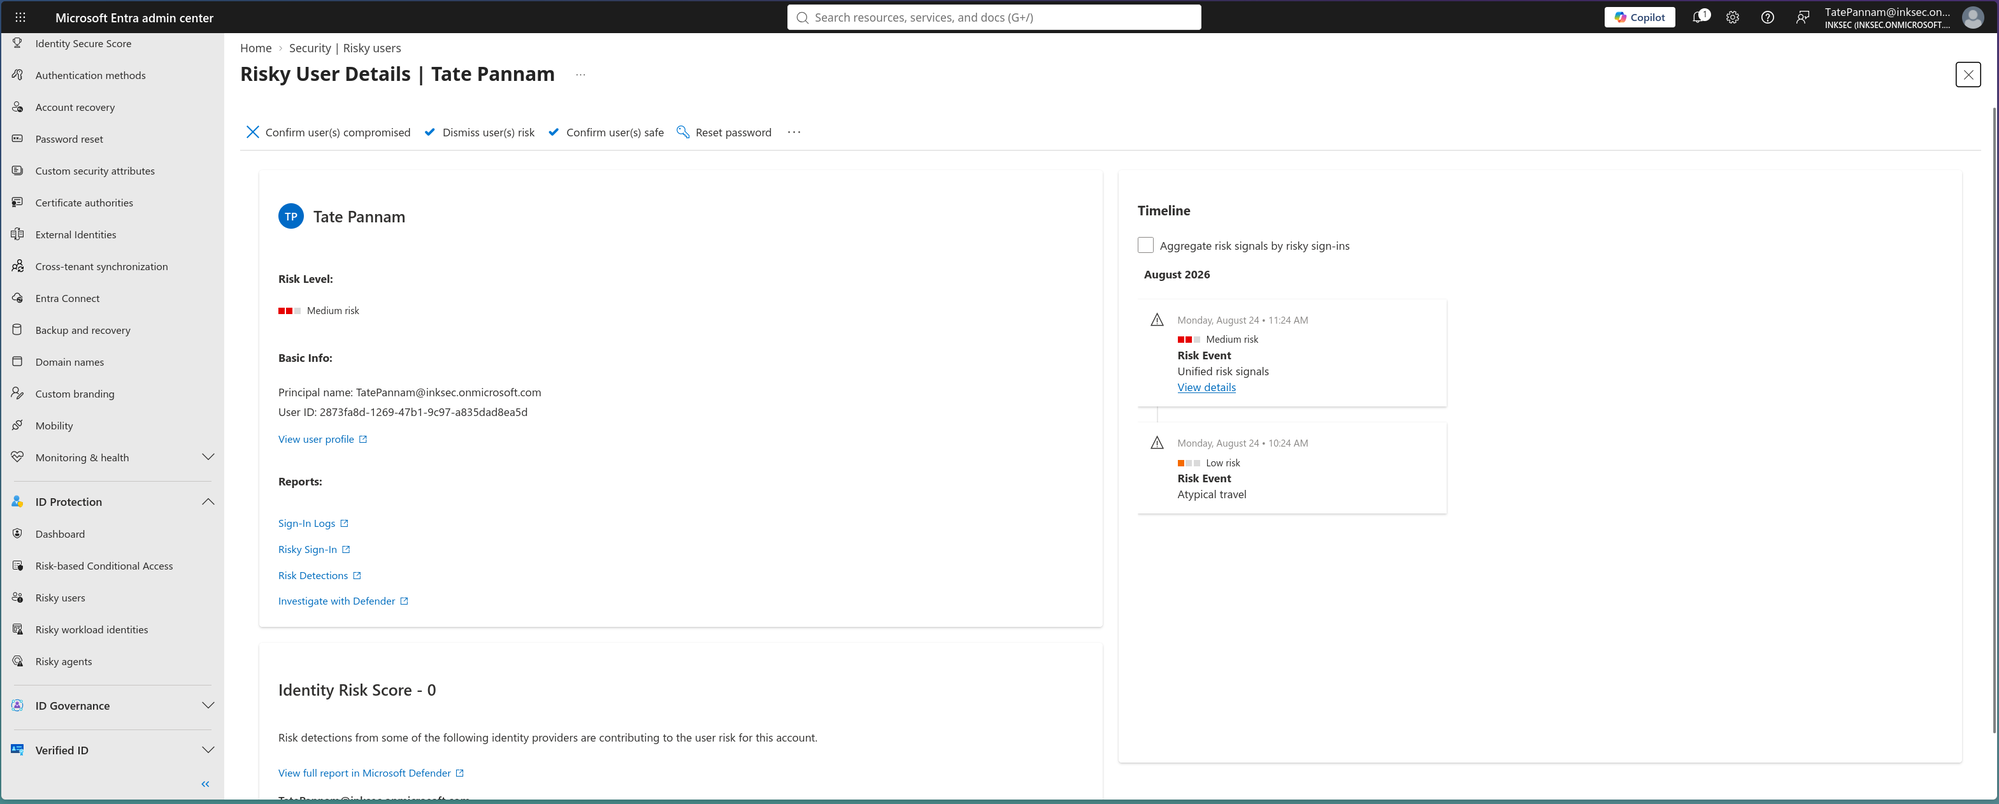 The timeline behind that flag: an Atypical travel risk event, followed by Entra’s own correlation layer escalating it to a broader Unified risk signals event minutes later — the same individual-signal-to-correlated-case pattern already seen on the endpoint side in Part 6, this time playing out on the identity side.
Australia to Thailand inside a five-minute window isn’t a subtle pattern — it’s a physically impossible jump, the exact shape “impossible travel” detection exists to catch, and the platform caught it cleanly.
Two different risk engines, two different data sources — Defender for Endpoint watching process and script behavior, Entra ID Protection watching sign-in geography and session properties — both converged on the same pattern in Part 6 and Part 7: a single unusual signal gets correlated by the platform itself into a broader case, rather than staying an isolated data point a human has to notice and connect by hand.
Closing
The point of running three environments wasn’t redundancy — it was matching each one’s cost and volatility to the story it needed to tell. The training lab stayed up cheaply and permanently to prove a repeatable SOAR pipeline; the noisy range spun up expensively and briefly to prove the workspace holds up under real attacker volume and that the alerts weren’t just read, but caused; the live tenant proved what it actually takes to get from a blank license to a real, unseeded detection — on the endpoint and in identity both — and was torn down the moment that proof was captured.